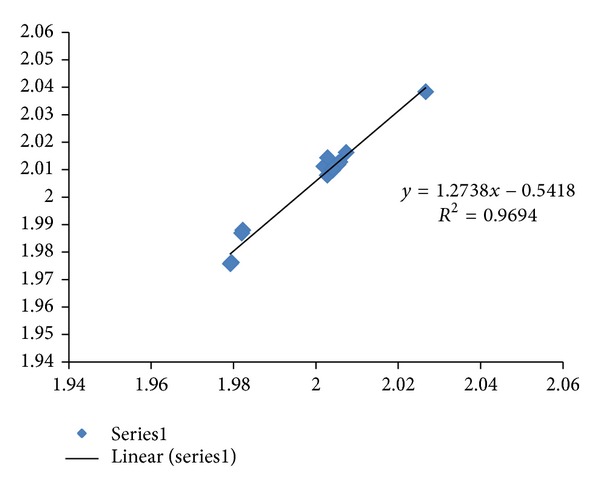
Figure 1.

The fractal dimension correlation of the APP, APOE, PSEN1, and PSEN2 CDSs versus mRNAs in Alzheimer's disease is displayed with R 2 of 0.969 (N = 15 Series1). The y-axis represents the fractal dimension (FD) of the CDSs, and the x-axis represents the FD of the mRNAs. Deletion of PSEN2 Variant 1 (1.9793, 1.9748) and Variant 2 (1.9791, 1.9743) where CDSs have lower fractal dimension values as compared to the mRNA sequences, which would give R 2 of 0.979, N = 13.
