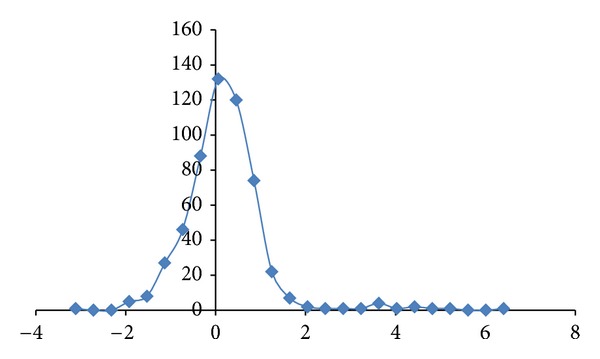
Figure 6.

HCRT expression level distribution in the brain regions (168 regions for each patient) using the 4-patient data from Allen Brain Atlas. The expression level z-score values are displayed in the x-axis. The displayed line is used as a visual guide. The Skewness of the distribution has been computed to be = 2.2.
