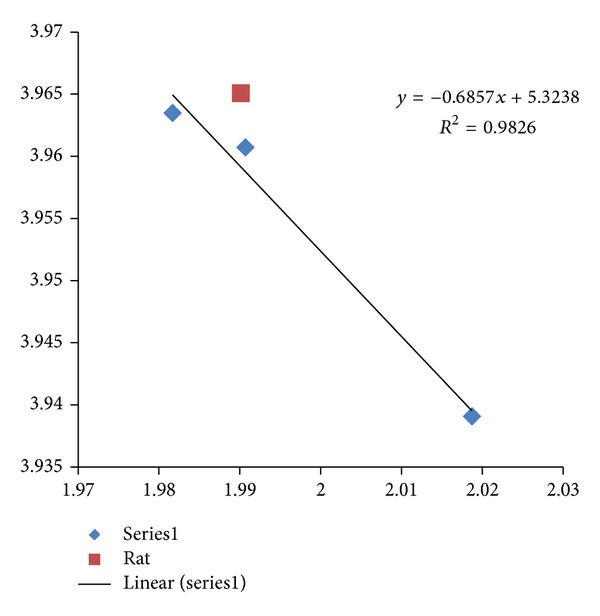
Figure 9.

A plot of fractal dimension versus entropy for HCRT-R2 CDSs in human, mouse, and zebrafish is displayed with R 2 of 0.982 and an adjusted R 2 of 0.965 (Series1 diamonds). The fractal dimension is represented on the x-axis, and the dinucleotide entropy is represented on the y-axis. Rat HCRT-R2 CDS would be viewed as an outlier (square) from the regression analysis of human (lowest fractal dimension), mouse and zebrafish (highest fractal dimension). GenBank information: mouse Mus musculus HCRT has Gen-ID-387285, rat Rattus norvegicus HCRT has Gen-ID-25605, and zebrafish Danio rerio HCRT has Gen-ID-561260.
