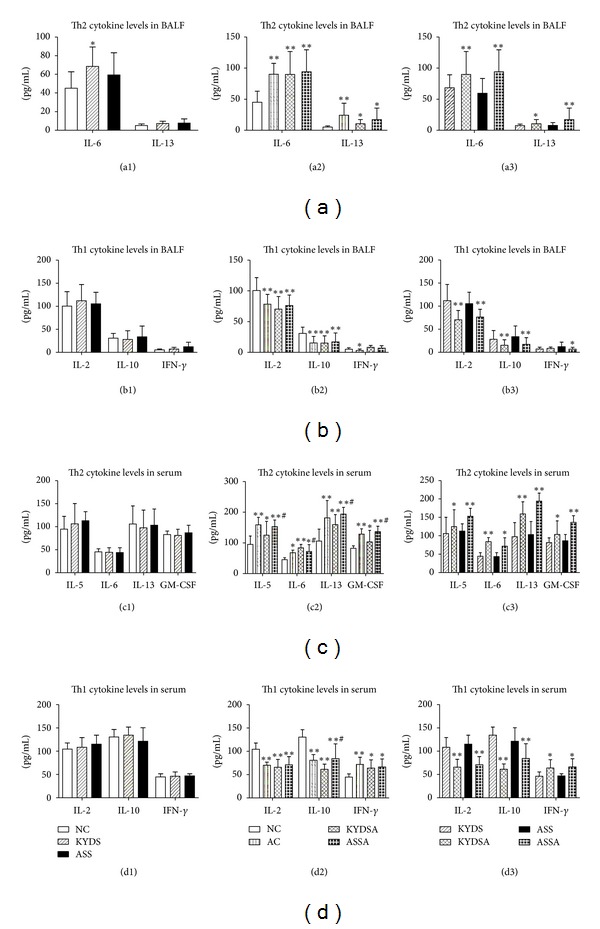
Figure 10.

Analysis of pro-inflammatory and anti-inflammatory cytokines in bronchoalveolar lavage fluid (BALF). BALF was harvested during the 24 h after last OVA challenge. Data are expressed as mean ± SD, n = 10 rats per group. (a1): *P < 0.05, versus the NC group; (a2) and (b2): **P < 0.01, *P < 0.05, versus the NC group; (a3) and (b3): **P < 0.01, *P < 0.05, versus the KYDS group or the ASS group. (c2) and (d2): **P < 0.01, *P < 0.05, versus the NC group; # P < 0.05, versus the KYDSA group. (c3) and (d3): **P < 0.01, *P < 0.05, versus the KYDS group or the ASS group.
