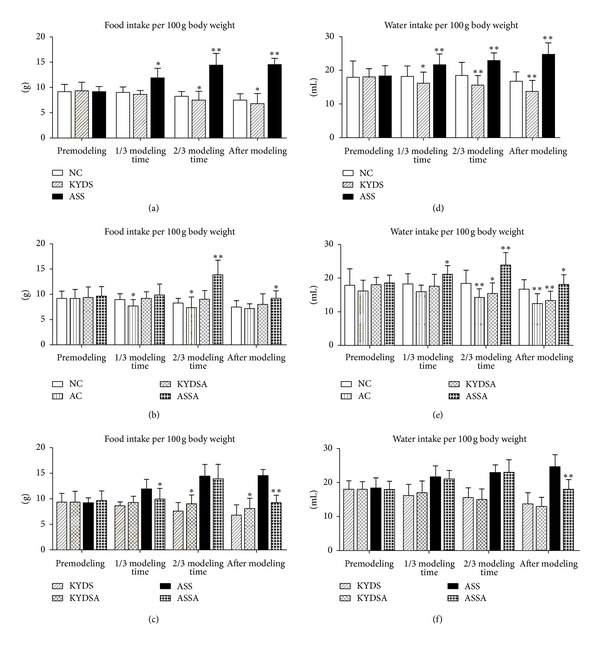
Figure 3.

Food and water intake were calculated during the three point time of the whole experiment process. Before the experiment, there was no significant difference in food and water intake among six groups. Data are expressed as mean ± SD, n = 10 rats per group. (a) and (d): **P < 0.01, *P < 0.05, versus the NC group. (b) and (e): **P < 0.01, *P < 0.05, versus the NC group. (c) and (f): *P < 0.05, versus the KYDS group or the ASS group.
