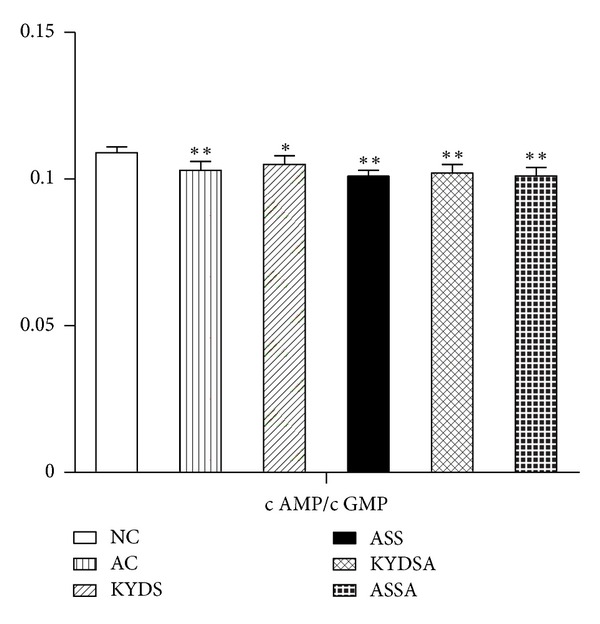
Figure 8.

Dysfunction of S/P nerve system was induced in the five modeling groups compared to the NC group. Data are expressed as mean ± SD, n = 10 rats per group. **P < 0.01, *P < 0.05, versus the NC group.

Dysfunction of S/P nerve system was induced in the five modeling groups compared to the NC group. Data are expressed as mean ± SD, n = 10 rats per group. **P < 0.01, *P < 0.05, versus the NC group.