Figure 2.

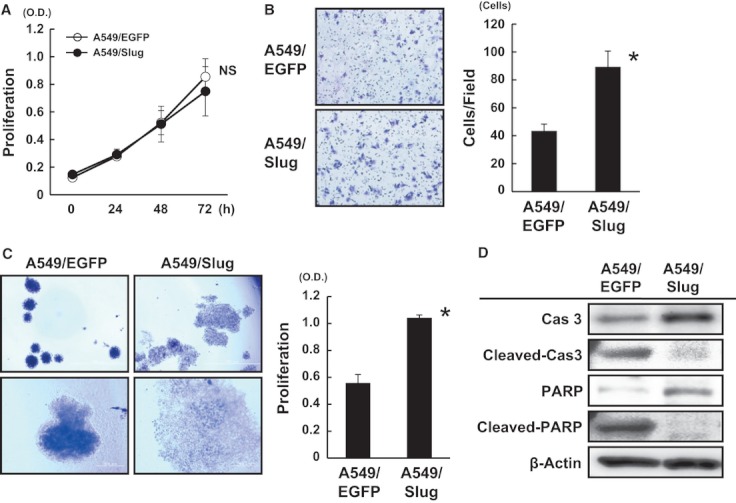
Slug enhanced anchorage-independent growth and cellular migration, but not cellular proliferation. (A) Cellular proliferation was examined using an MTT assay. No significant difference was observed between A549/EGFP and A549/Slug cells. The data shown represent the average ± SD of three independent experiments. ns: not significant. (B) A migration assay was performed using the Boyden-chamber method and both cell lines. The left panels show representative data. The data shown represent the average ± SD of three independent experiments. *P < 0.05. (C) Anchorage-independent cell growth was evaluated using an ultra-low attachment surface plate. The cells were seeded onto a plate containing RPMI 1640 with 10% FBS and cultured for a week. The cells were stained with trypan blue and observed immediately using a light microscope. The upper panel shows pictures obtained at a low-power field, and the lower panel shows pictures obtained at a high-power field. The cellular proliferation was evaluated using an MTT assay (right panel). The data show the average ± SD of three independent experiments. *P < 0.05. (D) Western blot analysis for caspase 3 and PARP with cleaved or noncleaved forms. The cells were cultured on low attachment surface plates under anchorage-independent growth conditions for 24 h and collected for analysis. Cas 3, caspase 3. β-actin was used as an internal control. EGFP, enhanced green fluorescent protein; SD, standard deviation; FBS, fetal bovine serum; PARP, poly (ADP-ribose) polymerase.
