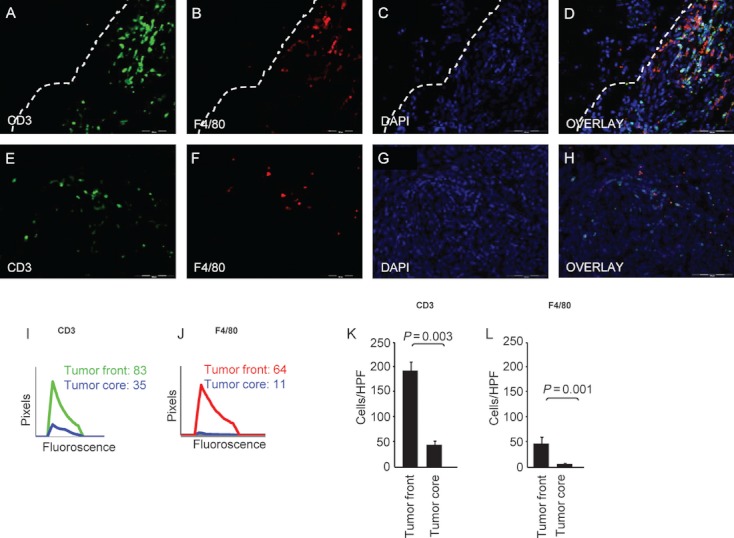
Figure 3.

Immune trafficking of CNS melanoma metastasis microenvironment in surgically excised human specimens. (A–D) Immunofluorescence staining with anti-CD3 (green) and anti-F4/80 (red) Abs. Nuclei were stained with Dapi-Fluoromount-G (blue). Fluorescence analysis showed the same pattern of infiltration of CD3+ and F4/80+ predominantly at the tumor front. Dashed line represents tumor–brain intersection. (E–H) Similar immunostaining in the tumor core, showing reduced immunocyte infiltration. (I) Curves representing quantitative image analysis of the immunofluorescence intensity of CD3+ and (J) F4/80+ cells. The numbers denote mean fluorescence intensity (MFI). Data are representative of three independent experiments (P < 0.05). (K) Histogram showing quantification of CD3+ cells (mean ± SEM; n = 10). (L) Histogram showing quantification of F4/80+ cells. All scale bars are 100 μm.
