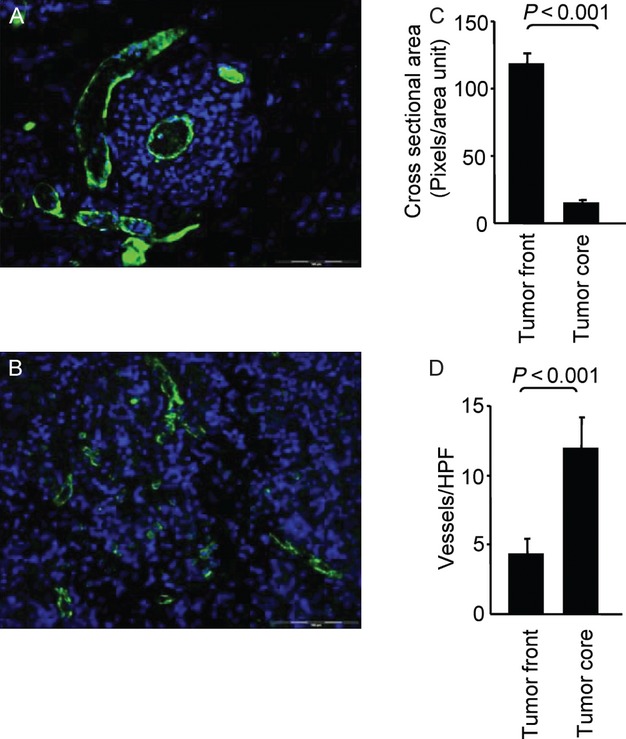
Figure 5.

Immunohistochemical analysis of angiogenesis in human. (A) Immunofluorescence staining with anti-CD31 (green) Ab of the tumor front and (B) the tumor core. Nuclei were stained with Dapi-Fluoromount-G (blue). The tumor front contained 4.3 ± 1.1 vessels per high-power field (HPF) compared with 11.9 ± 2.3 vessels per HPF within the tumor core (mean ± SEM, n = 10; P < 0.001). (C) Histograms showing vessel area. (D) Histograms showing vessel number. The microvessel density (MVD) was calculated in each region. The MVD was 12 times higher within the tumor core compared with the tumor front (n = 10; P < 0.001). Dashed line represents tumor–brain intersection. All scale bars are 100 μm.
