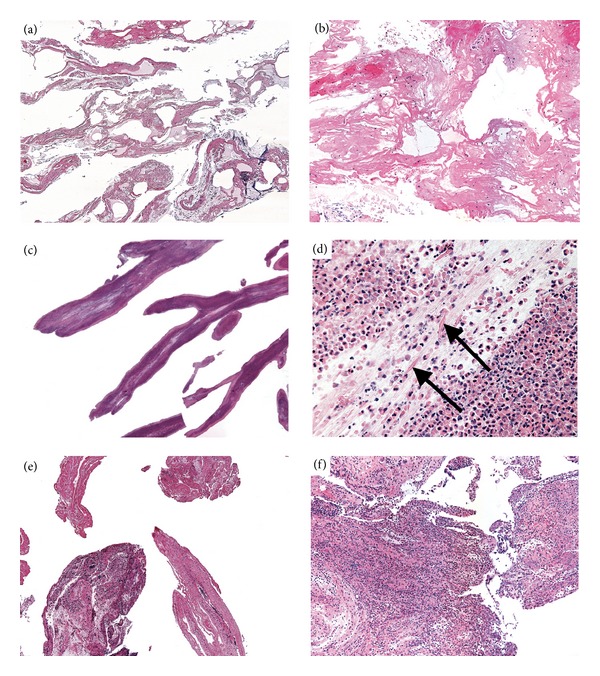
Figure 2.

Histology from representative casts. Hypocellular fibrinous casts from patient 1 (case vignette) at 10x magnification (a) and 100x (b). Inflammatory casts from patient 9 showing eosinophils, Charcot-Leyden crystals and mucin at 10x (c) and 200x (d) arrowheads indicate Charcot-Leyden crystals. Casts from patient 3, showing hypocellular ((e), 40x) and inflammatory ((f), 100x) sections in the same specimen.
