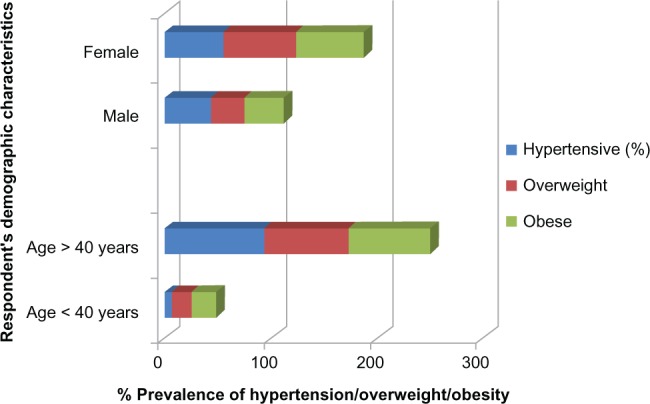
Figure 1.

Association between demographic characteristics and hypertension and BMI.
Notes: Statistics: Age vs hypertension: x2 = 16.274, df 3, P 0.001; Age vs BMI: x2 1.608, df 2, P 0.448. Sex vs hypertension: x2 = 2.904, df 3, P 0.04; Sex vs BMI: x2 1.608, df 2, P 0.448.
Abbreviation: BMI, body mass index.
