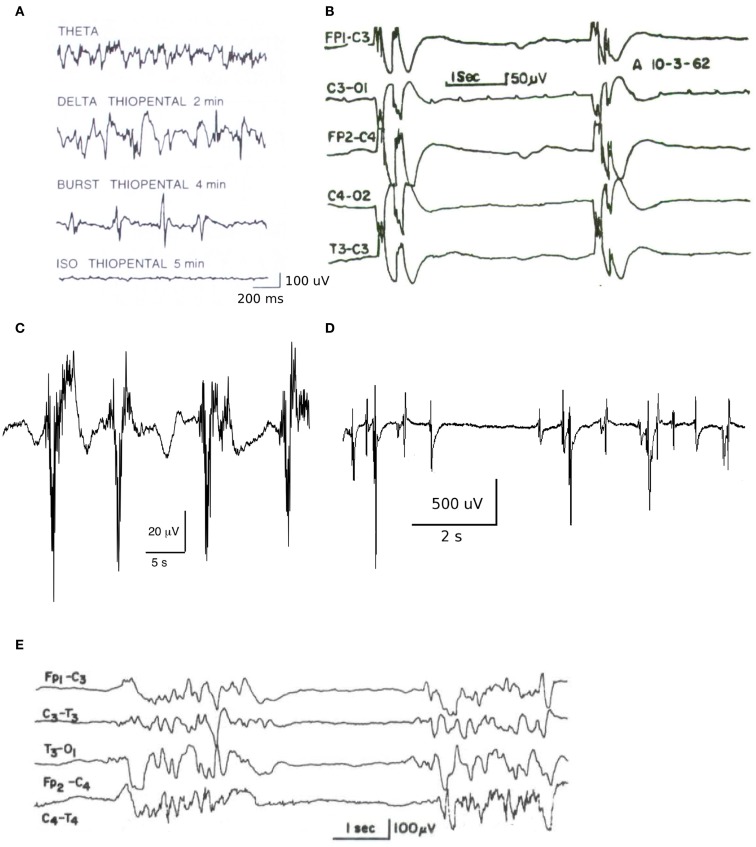
Figure 1.
Example traces of electroencephalogram and electrocorticogram illustrating the heterogeneity of BS patterns. (A) Changes in neocortical electroencephalogram in the rat, recorded using dural surface electrodes, in response to a 5 mg/kg/min thiopental infusion [figure reproduced with permission from Lukatch and MacIver (1996)]. (B) Electroencephalogram recorded in acute anoxia showing a clear burst-suppression pattern with grouped spikes [figure reproduced with permission from Hockaday et al. (1965)]. (C) BS pattern during closed loop target controlled propofol infusion at a target level of approximately 15 μg/ml (data courtesy of Professor Michel Struys, Groningen). Note the bursts consist of fast activity (>10 Hz) on a slow wave background. (D) Electrocorticogram obtained from an adult merino sheep during deep enflurane anesthesia, demonstrating high amplitude spikes interspersed with isoelectric periods of variable length [figure reproduced with permission from Voss et al. (2006)]. (E) Electroencephalogram recorded from a 3-month-old infant suffering from infantile myoclonic encephalopathy [reproduced with permission from Niedermeyer (2005)].

