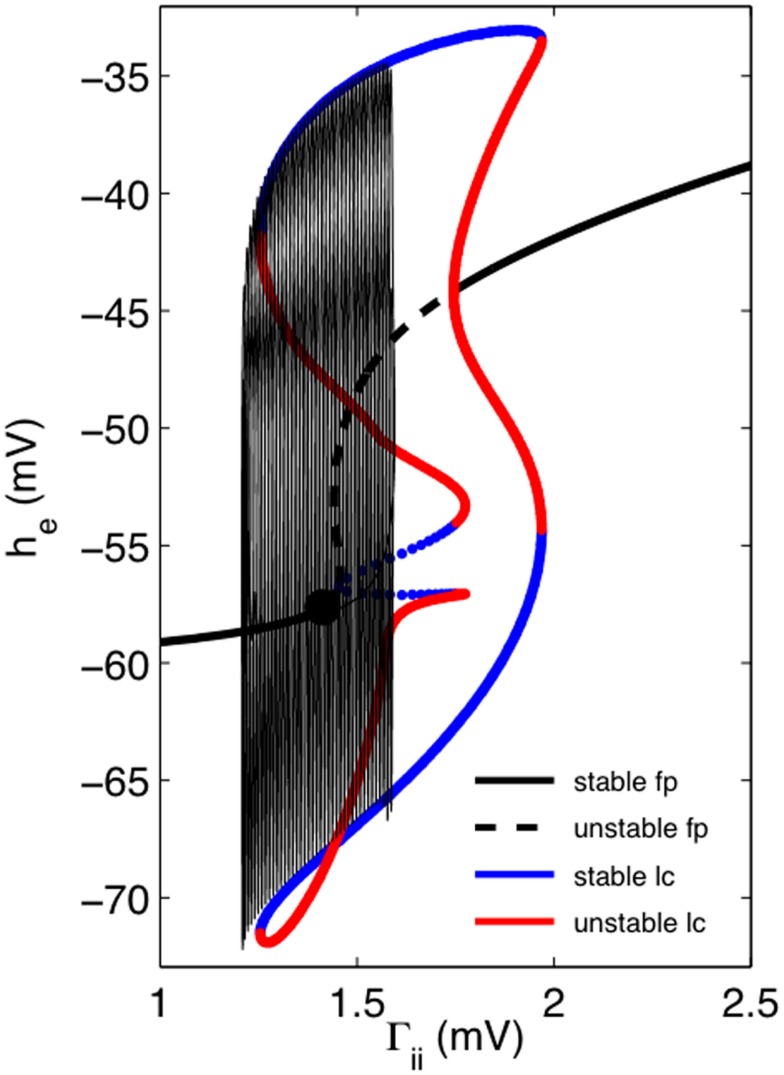
Figure 4.
One-dimensional continuation of the “fast” EEG system in he suggests how we might account for the dynamics of bursting. Thick black lines (solid = stable, dashed = unstable) shows the fixed points (fp) as a function of Γii. Solid black circle indicates fixed point for the default parameter values for “fast” EEG system (parameters as for Figure 3). Solid blue lines indicate the locus of maximum and minimum amplitudes respectively of stable limit cycle (lc) activity, whereas solid red lines correspond similarly to locus of unstable limit activity. Transitions between stable and unstable lc activity is predominantly through fold-limit cycle bifurcations, except for middle limit cycle branch where transition is through a torus bifurcation. Superimposed on this one-dimensional bifurcation diagram is the trajectory of a single burst.

