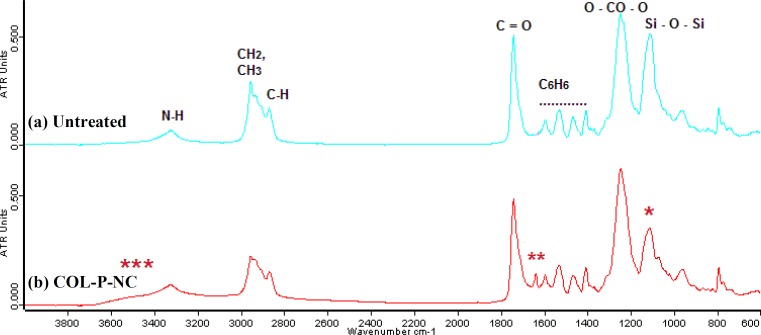
Fig. 4.
ATR-FTIR spectra of (a) untreated nanocomposite and (b) collagen-grafted nanocomposite. *** broad peak which is located at 3000-3600 cm-1 can be ascribed to the stretching of the hydroxyl groups (-OH) or NH groups from grafted collagen groups; ** a new peak at 1648 cm-1 which might belong to vibration of amide groups because of collagen immobilization; * is a decrease in strength of Si-O-Si bands, (between 900-1100 cm-1) which may be attributed to the breaking of covalent bonds and chain scission events as a result of plasma treatment before collagen graft.

