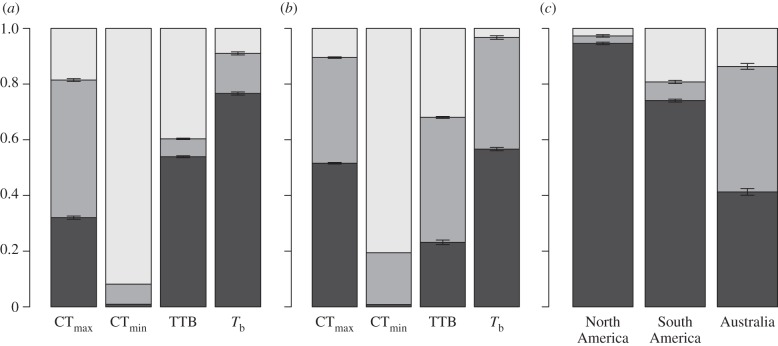
Figure 2.
The stacked contributions of phylogeny (φ, black) and space (λ′, grey) to patterns of thermal tolerance vary by metric (unaccounted for variance: γ, light grey). 95% CIs across the randomizations are depicted. We depict the contributions when characterizing both (a) geographical and (b) (mean annual) temperature space. We additionally analyse the determinants of body temperature (Tb) within continents.

