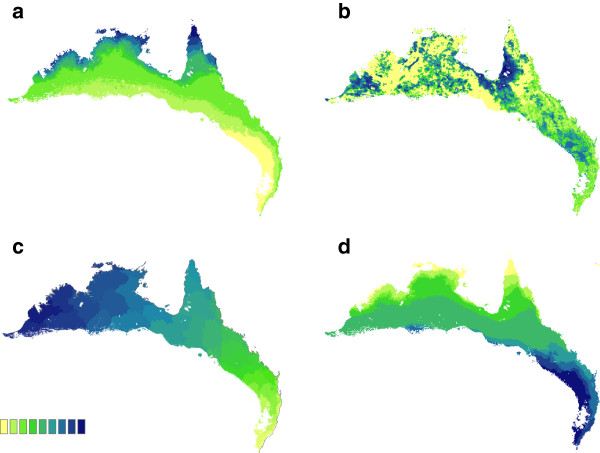
Figure 2.
Predicted spatial patterns of phenotypic variation. Shown are model results for (a) wing length, (b) bill plus head length, (c) plumage hue, and (d) male tail length, as determined by the full generalized dissimilarity model for each trait. Maps for the remaining morphometric traits are not shown. Differences in color are proportional to differences in the trait value across the landscape (see color bar for scale).

