
Figure 3.
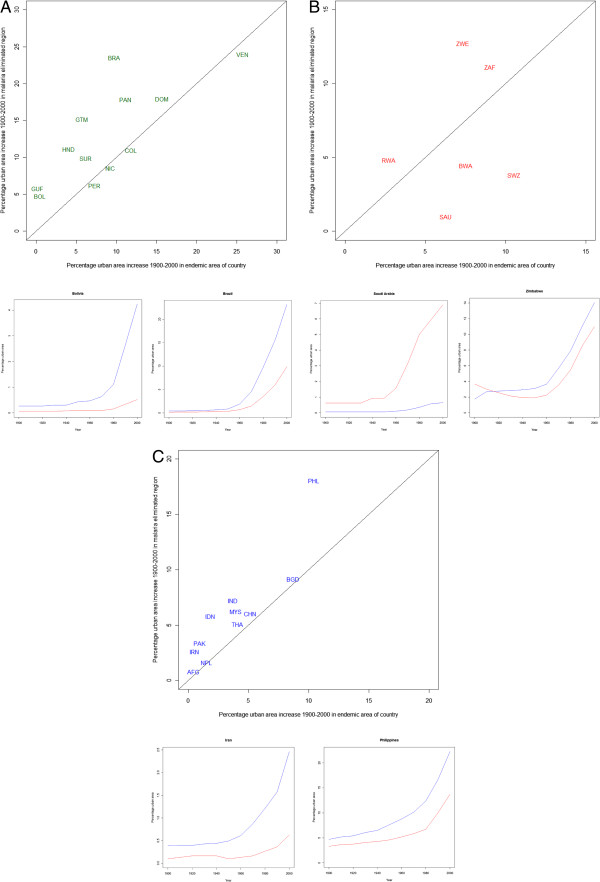
Plots showing urban area changes 1900-2000 between areas of countries that remain malaria endemic today, and those that have undergone elimination for (a) the Americas, (b) Africa plus Arabian peninsula and (c) Asia. In each case, scatterplots of urban area increases in endemic versus eliminated areas with one-to-one lines overlaid are shown at the top, and example plots of trends in urban area percentages between areas that eliminated malaria (blue) and that remain endemic (red) are shown at the bottom (the full set of these plots is provided in Additional file 9). The ISO country abbreviation for country name is used on the scatterplots ( http://www.iso.org/iso/english_country_names_and_code_elements).