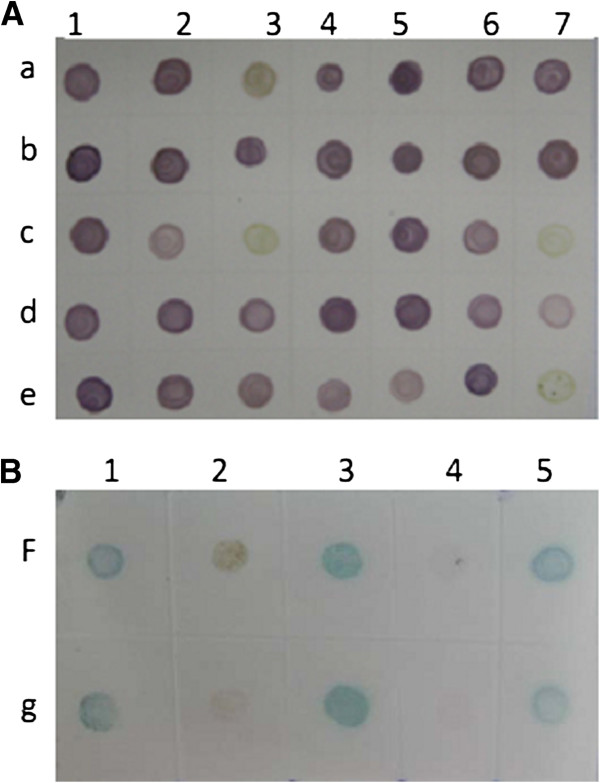
Figure 5.
The detection results of field plant (A) and planthopper (B) samples by the dot-ELISA. A: The detection results of field plant samples by the dot-ELISA. Lines a and b were maize samples, and a3 and b3 were the negative and positive controls, respectively. Lines c and d were rice samples, and c3 and d3 were the negative and positive controls, respectively. Line e was wheat samples, and e6 and e7 were the positive and negative controls, respectively. Brown or purple color spots indicated positive samples and no color or green spots indicated negative samples. B: The detection results of field planthopper samples by the dot-ELISA. f1 and f2 were viruliferous and non-viruliferous small brown planthoppers used as the positive and negative controls, respectively. f3-5 and g1-5 were small brown planthoppers from fields. Blue color spots indicated positive samples and no color or brown spots indicated negative samples.

