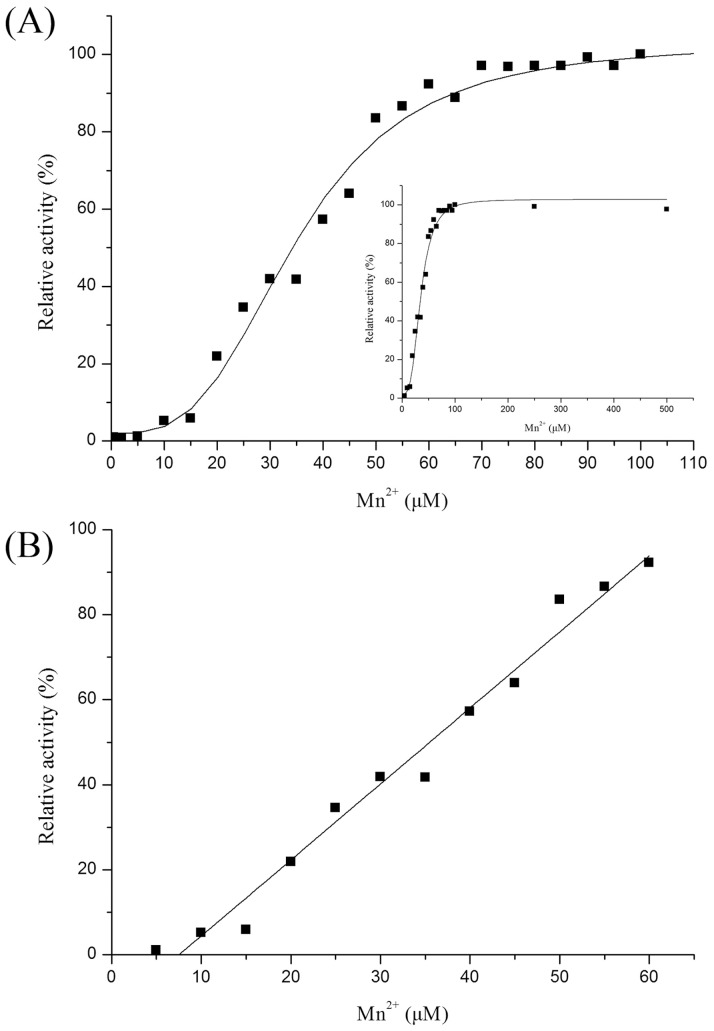
Figure 4. Effect of Mn2+ on the catalysis activity of C. scindens DPEase.
Panel A showed the relative activities in conditions of 0–100 µM Mn2+. The curve in the inset represented the effect of Mn2+ with broad concentration range from 0 to 600 µM. And panel B represented the linear range of Mn2+ concentration effect on the enzyme activity. The experiments were developed with 1 µM C. scindens DPEase.

