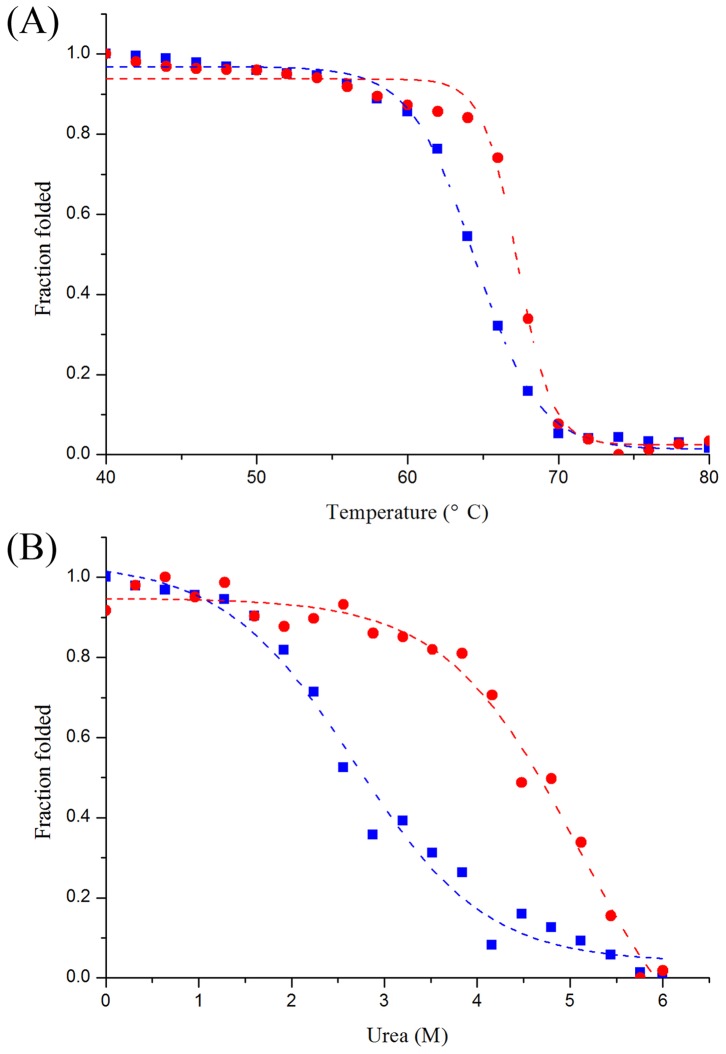
Figure 5. Thermal (A) and urea-induced (B) unfolding of C. scindens DPEase.
The symbols ▪ and • represented the unfolding curves of C. scindens DPEase in the absence and presence of Mn2+, which were monitored by CD. The CD measurements and unfolding analysis procedures were shown in Materials and Methods.

