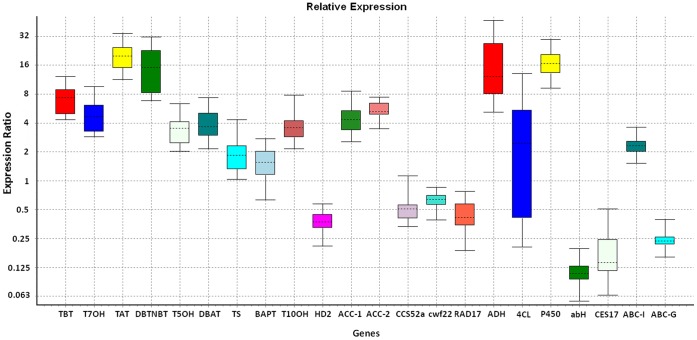
Figure 4. Expression analysis of 22 representative genes in nonelicited and elicited cells by qRT-PCR.
Y-axis indicates the relative expression distribution of a ratio of elicited cells versus nonelicited cells with actin as the reference gene. X-axis displays 22 selected genes, whose full names were given in Table 2. The boxes indicate 50% of observations near the median represented by the dotted line, and the whiskers show the outer 50% of observations.

