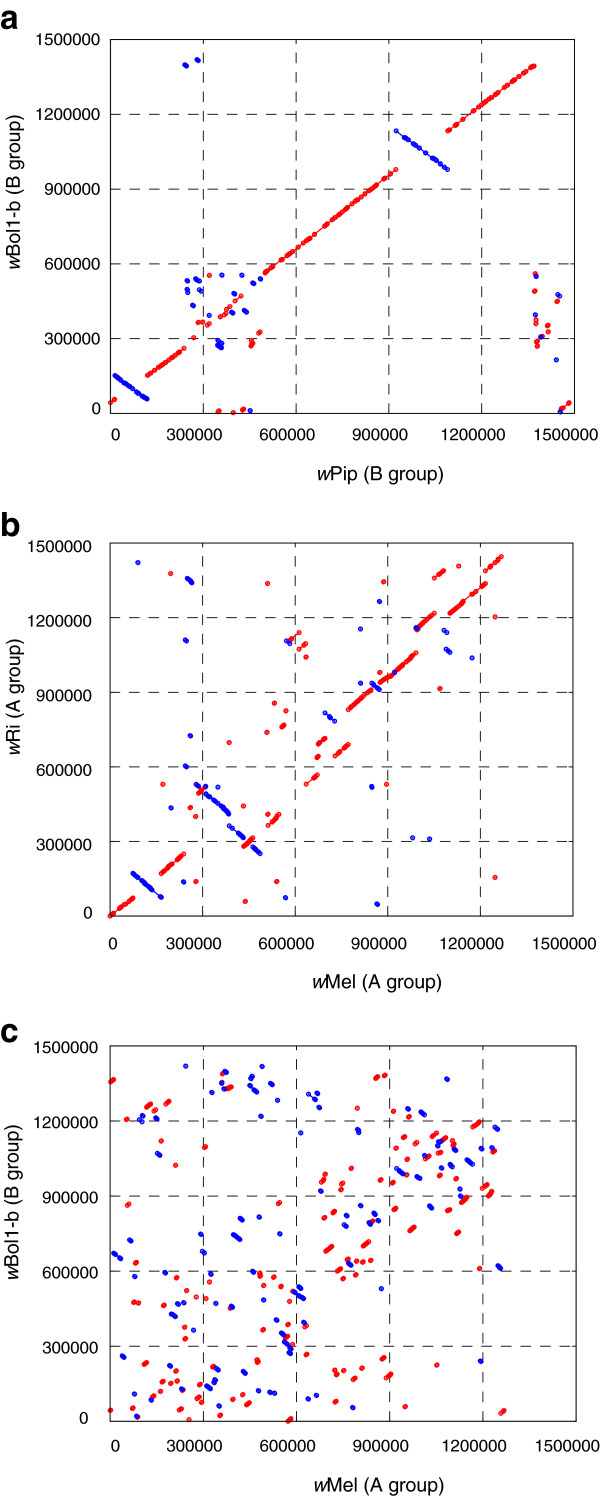
Figure 2.
Dot plots showing differences in syntenic conservation between Wolbachia genomes. Dots and lines represent unique genomic sequence matches, red for a forward match and blue for a reverse match (inversions). Comparisons are shown between the genomes of (a) wBol1-b and wPip, the two complete B-group genomes, (b) wMel and wRi, the two complete A-group genomes, and (c) wBol1-b and wMel, a representative comparison between A- and B-group genomes. Numbers along the axes represent genome coordinates.

