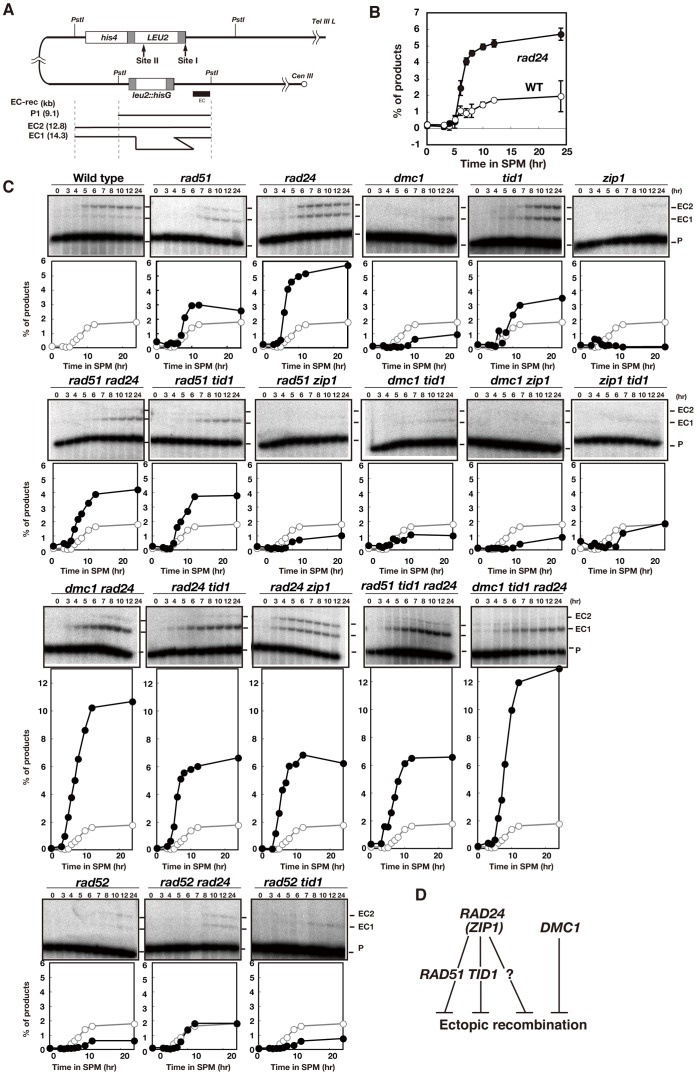
Figure 1. Meiotic ectopic recombination in various mutants.
(A) Schematic representation of the HIS4-LEU2 and leu2::hisG loci. Homologous regions between the HIS4-LEU2 and leu2::hisG loci for ectopic recombination are shown in gray boxes. (B) Ectopic recombination in wild-type (WT) and rad24 mutant cells was analyzed by Southern blotting. Genomic DNA was digested with PstI. The percentage of ectopic recombination products (i.e., the relative amount of EC1 and EC2 bands) is shown. Error bars were obtained from three independent time courses. The error bars represent standard deviations (n = 3). Wild type, open circles; rad24 mutant, closed circles. (C) Ectopic recombination in various mutants was analyzed by Southern blotting. Quantification of products as in B is shown. For each strain, at least two independent time courses were performed. Representative data are presented for each mutant strain (closed circles); wild-type data (open circles) are described in each blot for comparison. (D) A model overview of pathways for the suppression of ectopic recombination. The “?” gene is a putative gene which may suppress ectopic recombination.

