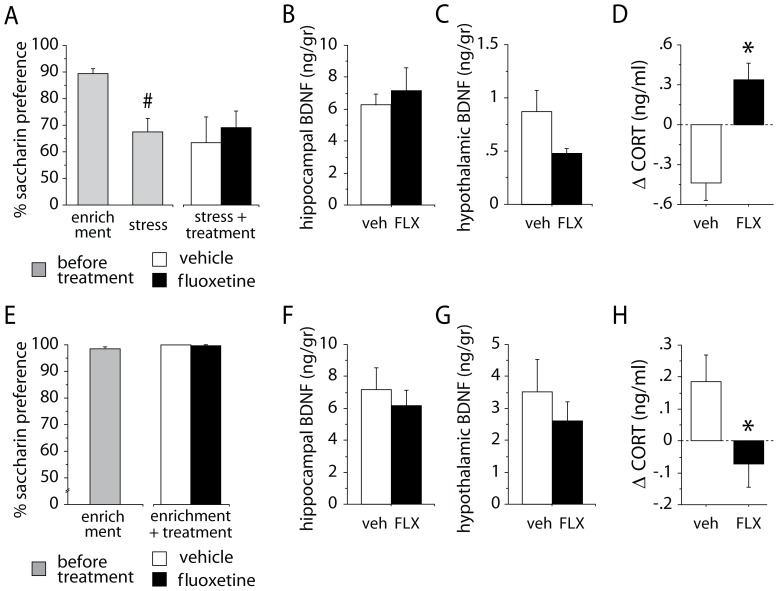
Figure 6. Results of experiments investigating the effects of fluoxetine treatment in a constant environment.
(A,B,C,D) Fluoxetine treatment in a stressful condition, after exposure to stress. (A) Saccharin preference: exposure to stress before treatment significantly reduced saccharin preference. The following fluoxetine treatment administered in stressful conditions did not modify the anhedonic response. (B) Hippocampal and (C) hypothalamic BDNF levels: no difference between the two groups has been found. (D) Corticosterone levels. Fluoxetine mice showed a significant increase in corticosterone levels compared to vehicle. (E,F,G,H) Fluoxetine treatment in an enriched condition, after exposure to enrichment. (E) Saccharin preference: no difference between the two groups has been found. (F) Hippocampal and (G) hypothalamic BDNF levels: no difference between the two groups has been found. (H) Corticosterone levels: fluoxetine mice showed a significant decrease in corticosterone levels compared to vehicle. * indicates p<0.05 vs. vehicle group. # indicates p<0.01 vs. baseline level. Delta (Δ) values were calculated comparing data obtained on the day before treatment and on last day of treatment. Data are means ± S.E.M.

