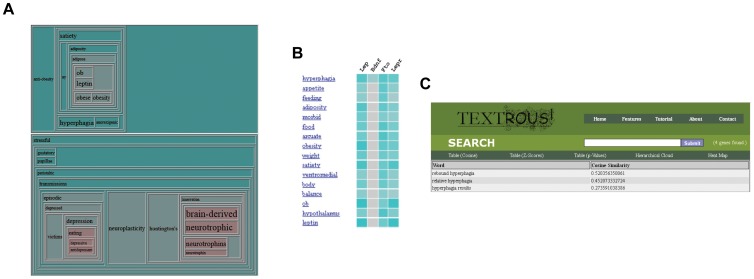
Figure 3. Diverse Textrous! processing formats.
(A) An illustration of the hierarchical cloud displaying multiple themes produced by collective processing. The hierarchical cloud shows depression and stress at the conjunction between terms related to the central nervous system and terms related to obesity. Each cell is color-coded to represent the time at which joins were made. Font sizes are adjusted in proportion to the calculated cosine similarities. (B) An illustration of the heat map produced by individual processing. The top associated (Cosine Similarity) terms are shown, as well as the relationships amongst genes. Here, the heat map shows that the top words are obesity-related, and that “Bdnf” is dissimilar to the other genes in the query. Grey color indicates a relative lack of association, while the intensity of teal color corresponds directly to the strength of correlation of each pairwise association. (C) Each of the output textual terms can be hyperlinked, via clicking on the word, to their associated top-scoring (Cosine Similarity) phrases. In this panel the output word term ‘hyperphagia’ was linked out to its associated phrase contexts.

