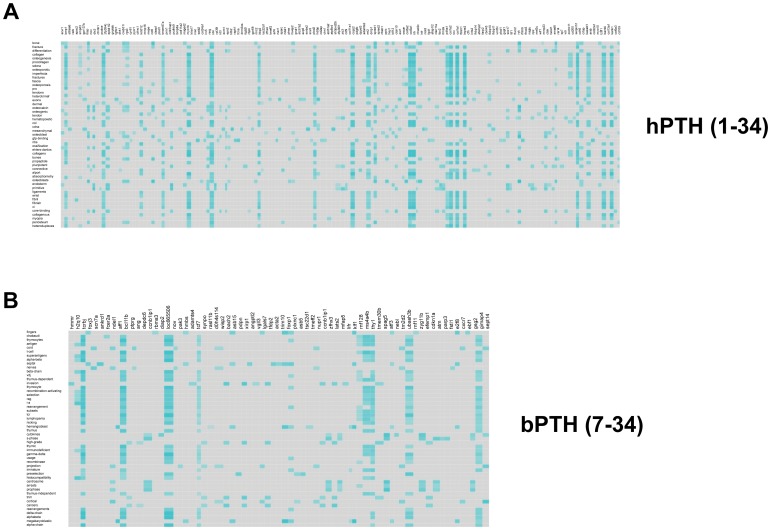
Figure 8. Textrous!-mediated individual processing output of compare-and-contrast large datasets.
Individual processing heatmaps for hPTH (1–34)- and bPTH (7–34)-mediated transcriptomic activity in murine calvarial bone are demonstrated in panels (A) and (B) respectively. Teal-colored blocks indicate strongly-associated gene-word interactions in a intensity-sensitive manner, while grey blocks indicate no significant interaction.

