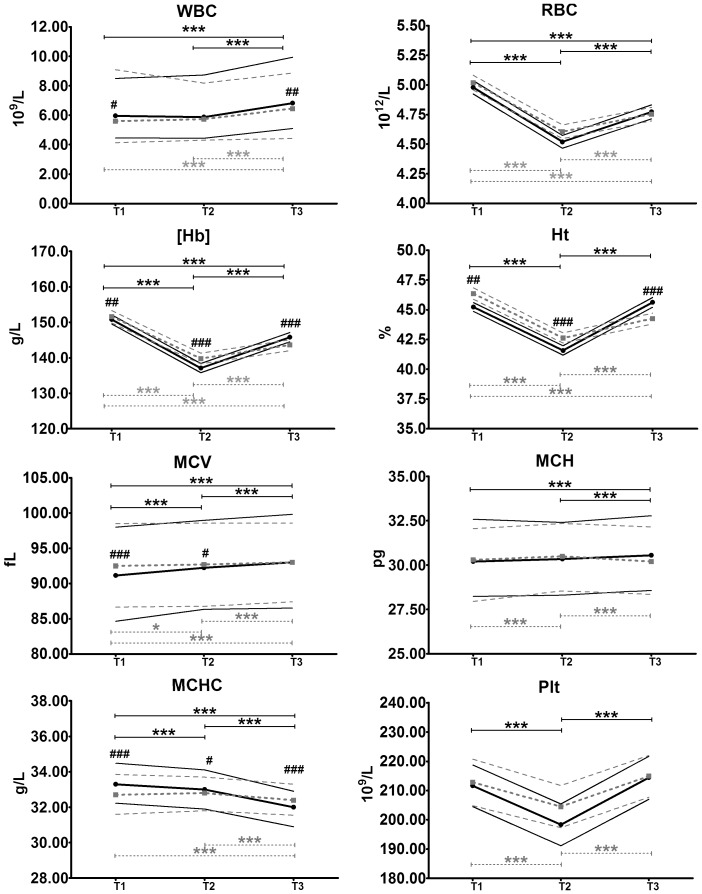
Figure 1. Hematological profile trends during the two races.
The figure shows the trends of white blood cells (WBC), red blood cells (RBC), hemoglobin concentration ([Hb]), hematocrit (Ht), mean corpuscular volume (MCV), mean hemoglobin content (MCH), mean corpuscular hemoglobin concentration (MCHC), platelets (Plt) during the 2010 (black • and solid line, n = 144) and the 2012 (grey ▪ and dotted line; n = 109) races. The thinner lines (solid for 2010 and dotted for 2012) represent the 5th–95th percentile for WBC, MCV, MCH and MCHC, while for RBC, [Hb], Ht and Plt they represent the 95% confidence intervals. The asterisks (*) indicate significant differences between different time-points in the same race (*: p<0.05; **: p<0.01; ***: p<0.001). # indicates that the value of the time-point in the 2012 race is significantly different from that recorded in the 2010 event (##: p<0.01, ###: p<0.001).

