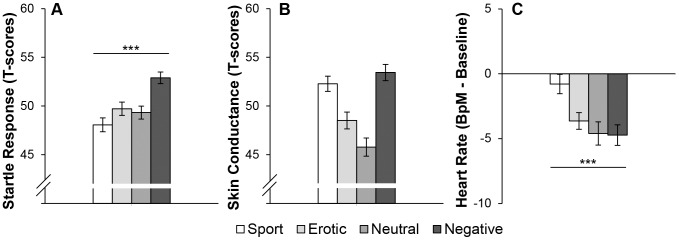
Figure 1. Physiological indices per Affective Category.

Panel A presents the average ASR data. Panel B presents the average SCR 10 seconds prior to both startle probes. Panel C presents average HR data relative to baseline of the 10 seconds prior to the startle probes. The film clips are ordered by subjective valence ratings, the line represents the linear trend of valence. ***p<0.001; Error bars represent SEM.
