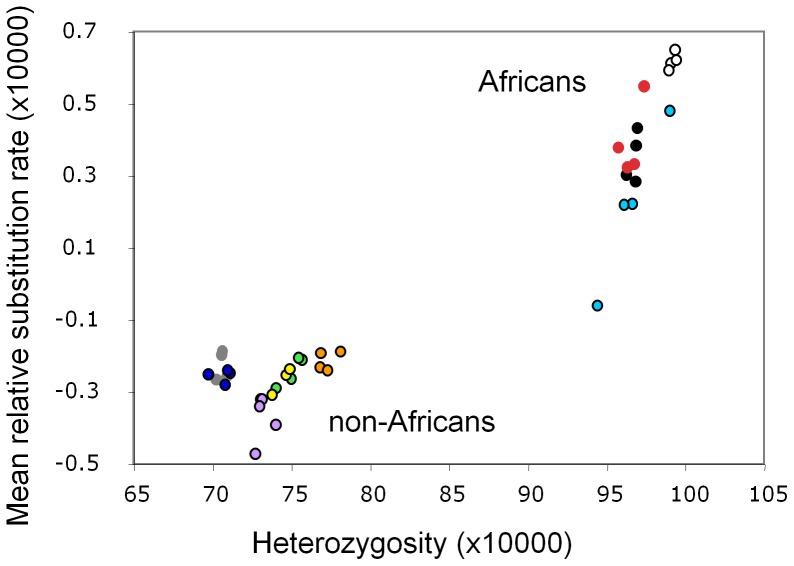
Figure 1. Relationship between substitution rate and heterozygosity among 40 humans from 10 populations.
Populations are: LWK (red), MKK (black), YRI (white), TSI (green), CHB (grey), JPT (dark blue), UTA (yellow), ASW (light blue), GUJ (orange), MXL (purple). Abbreviations are given in methods. Mean relative substitution rate is calculated for each individual relative to all others, negative scores indicating lower than average and positive indicating above average, and expressed as substitutions per qualifying base. Heterozygosity is calculated as the proportion of heterozygous sites among all qualifying bases. Both axes are scaled for clarity. Standard errors for each data point are nominally of the order of 0.035, making them too small to show clearly as error bars.

