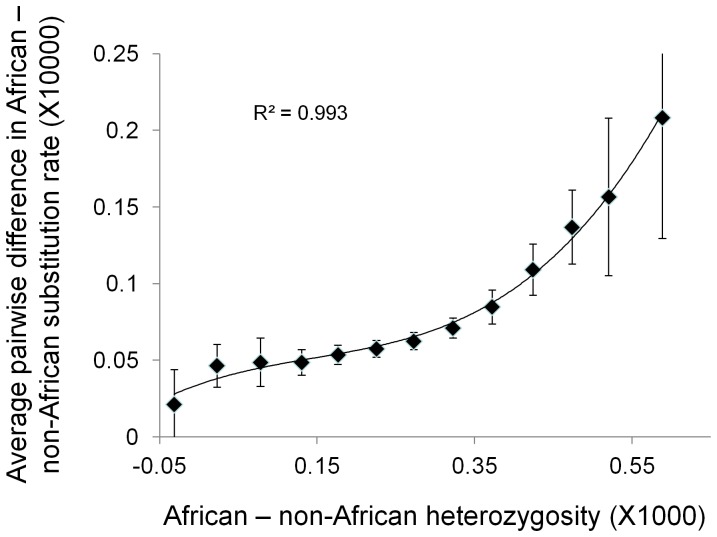
Figure 4. Average difference in heterozygosity between closely related populations in regions surrounding putative new mutations (PNMs).
PNMs are defined as derived variants that occur only once among 80 human chomosomes studied. The x-axis is heterozygosity in a less related outgroup population, quantified as total number of heterozyous sites in the 2 Kb window summed over all four individuals, while the y-axis is the difference in heterozygosity between the population in which the PNM was inferred and a closely related sister population, measured as average excess sites per individual. Reciprocal comparisons were conducted between two pairs of sister populations: Uta (open squares) and Tos (black squares) in Europe and Chb (grey crosses) and Jpt (grey circles) in east Asia. Outgroups were Jpt and Tos four Europe and East Asia respectively. In all cases, heterozygosity in the population in which the PNM was inferred is on average greater than in the control populaiton, this difference rising as heterozygosity increases in the outgroup. Results presented are weighted linearly by proximity to the putative new mutation, but an unweighted analysis yields essentially identical results.

