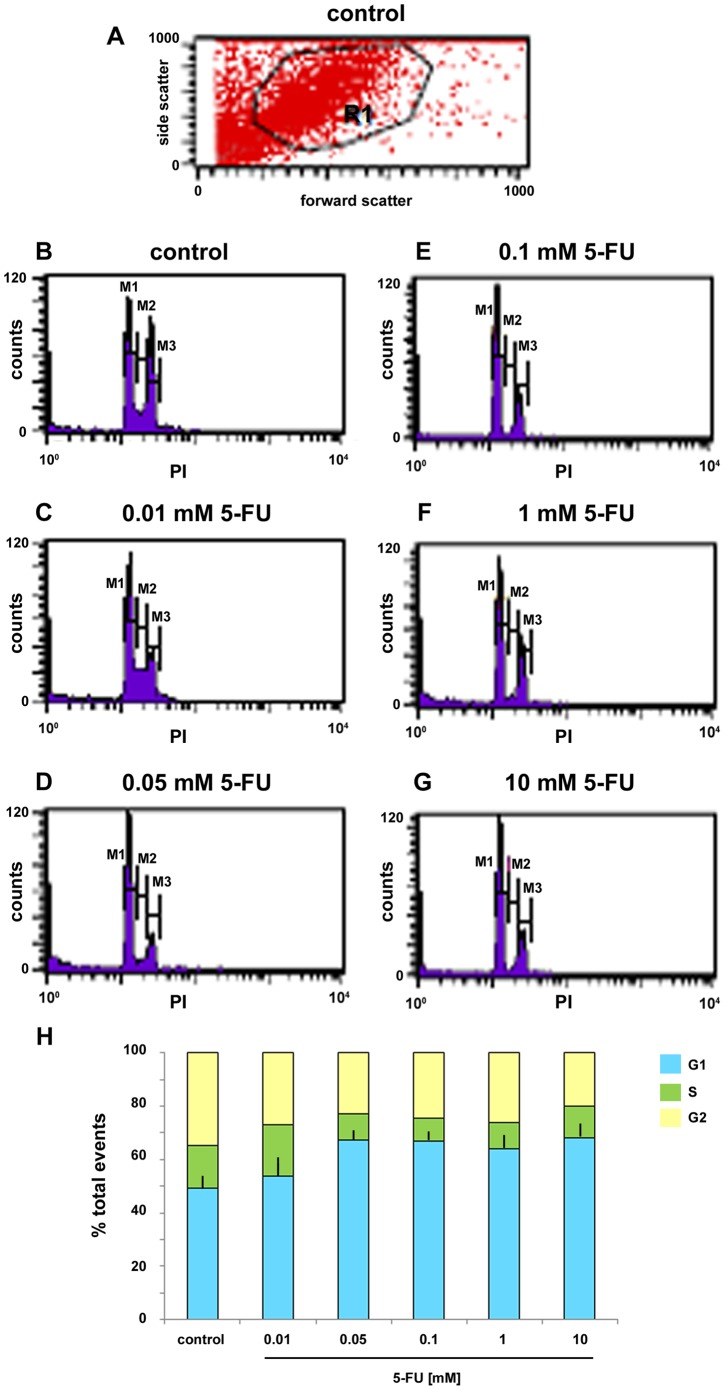
Figure 6. 5-FU blocks cell cycle progression in G1 phase.
Cell cycle analysis of control (A and B) and 5-FU treated cells (C-G) was evaluated by flow cytometry based on propidium iodide (PI) intercalation into the cellular chromatin (for details see Materials and methods). Data are presented as relative fluorescence intensity. (H) Cell sorter analysis revealed that the population of cells in the S and G2 phase was remarkably decreased by 5-FU. Values were represented as the means ± standard deviation.

