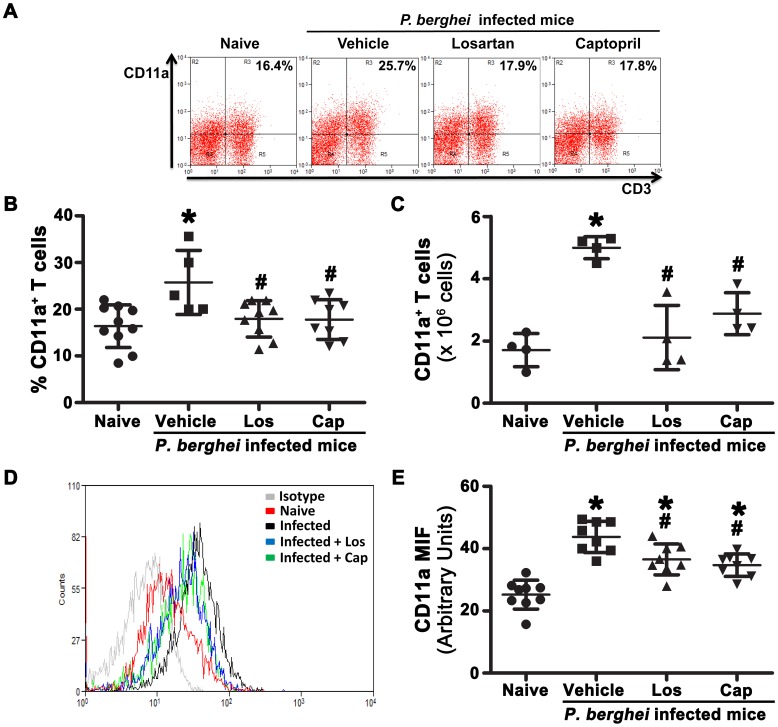
Figure 8. Ang II induces the upregulation of CD11a expression in splenic T cells during P.berghei ANKA infection.
C57BL/6 mice were infected with P. berghei ANKA and treated with vehicle, losartan or captopril by gavage. T cells were isolated at day 6 post infection, stained with fluorescent antibodies and analyzed by flow cytometry. (A) Representative dot plots of CD3+CD11a+ T cells. The percentage of CD11a+ T cells (B) and absolute number of CD11a+ T cells (C) were calculated. CD11a expression was analyzed by MIF on gated CD3+ T cells (D, E). The results are expressed as means±SD. Statistically significant compared with values for *naive mice (p<0.05) and #vehicle-treated mice infected with P. berghei ANKA (p<0.05).

