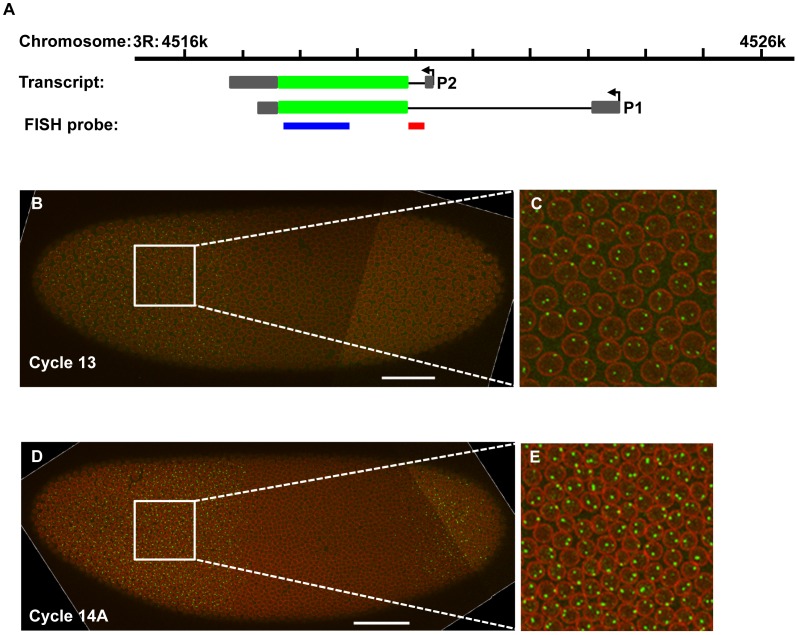
Figure 1. Intron staining detecting nascent transcripts near the hb P2 promoter.
(A) Shown is a schematic diagram of the hb locus and the locations of the probes used in this study. P1 and P2 are two promoters for hb transcription leading to two types of transcripts, where exons are represented by boxes with coding regions filled in green and non-coding in grey; introns are represented by thin lines. The heavy blue line represents the probe for detecting the mature hb mRNA and the heavy red line represents the intronic probe. (B) Shown is a merged confocal image of an embryo at cycle 13. The detected nuclear envelope is shown in red and the nascent hb transcripts detected (with an intronic probe) as intron dots are in green. Scale bar, 50 µm. (C) Shown is a magnified view of a section of the expression region from panel A. (E and F) Shown are a merged confocal image (E) of an embryo in cycle 14A and a magnified view (F) of a section of the expression region from panel C.

