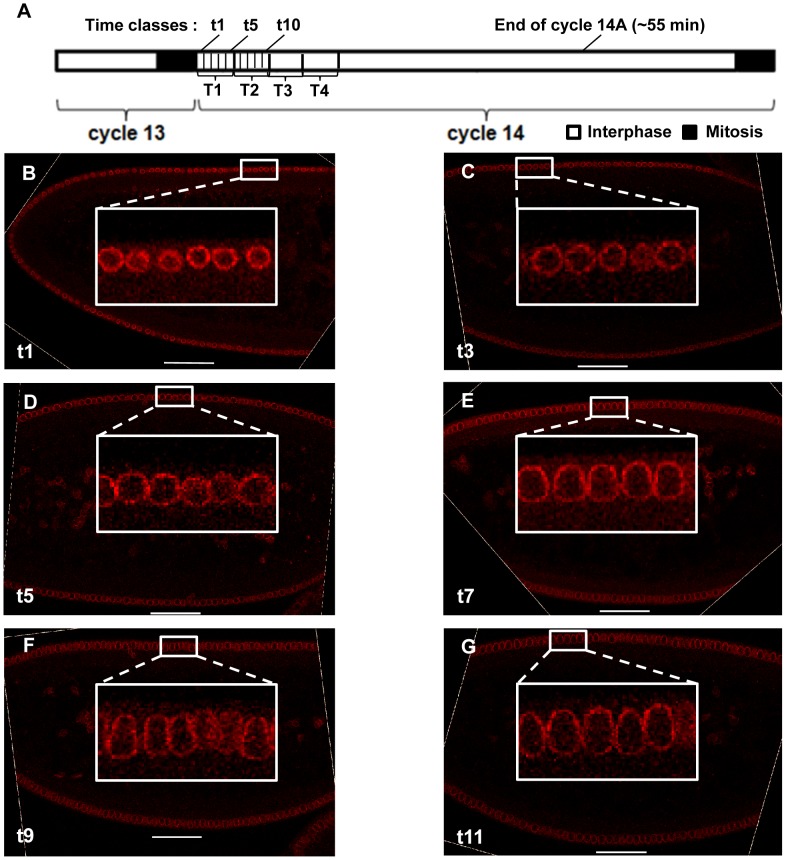
Figure 2. Progressive change in nuclear morphology during early cycle 14A.
(A) Shown is a schematic diagram depicting the relationship between the t and T time classes at cycle 14A and other time events. (B–G) Shown are midsagittal images of embryos time classes of t1 (B), t3 (C), t5 (D), t7 (E), t9 (F), and t11 (G), respectively. Here the nuclear envelope is shown in red, with the inserts exhibiting magnified views. Images shown here were adjusted for presentational purposes only. Scale bar, 50 µm.

