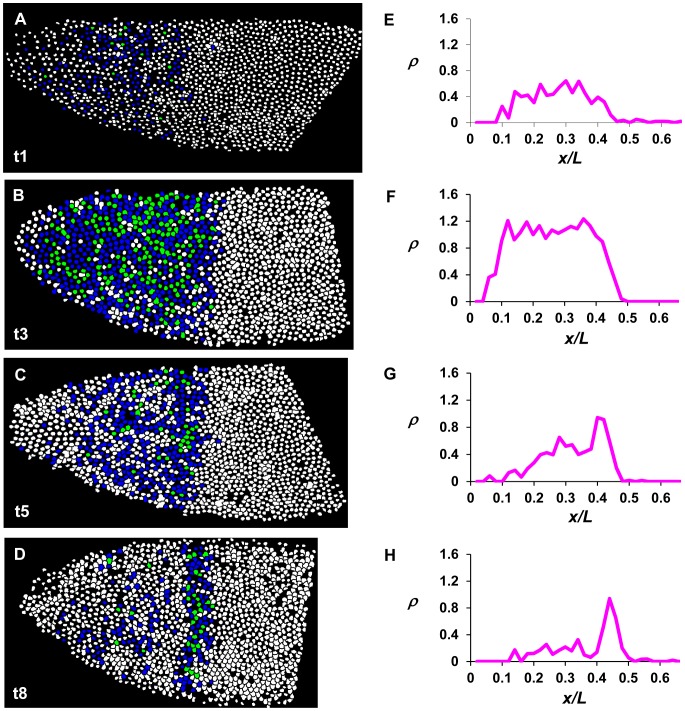
Figure 4. Quantitative analysis of active hb transcription at cycle 14A.
(A–D) Shown are diagrams of embryos at the time classes of t1, t3, t5 and t8, respectively. Here each nucleus detected from the confocal images is shown and assigned a color based on the number of detected hb intron dots (nascent transcripts were detected by an intronic probe): white, no intron dots; blue, one dot; and green, two dots. (E–H) Shown are the ρ profiles as a function of x/L from panels A–D, respectively. ρ is defined as the mean intron dot number per nucleus.

