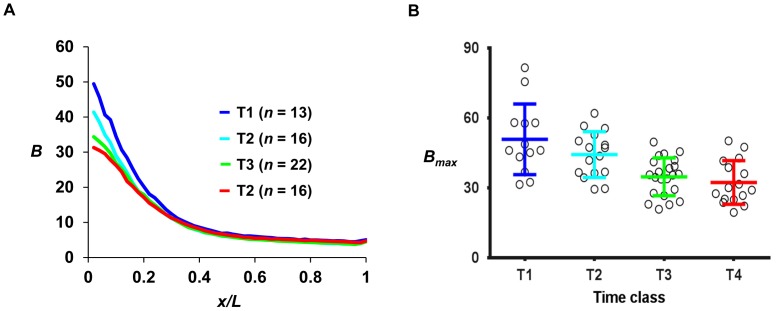
Figure 7. Bcd molecules are abundant at the time of hb transcription shutdown.
(A) Shown are the mean profiles of raw Bcd intensities (in arbitrary units) from cycle 14A embryos at different time classes. Each color represents a time class; the adjacent T time classes differ by ∼5 min (see Fig. 2A). For clarity, only mean profiles are shown. See Fig. S5 for individual profiles. (B) Shown are raw Bmax values (in arbitrary units) for individual embryos from different time classes T. The mean and standard deviation are: 50.92±15.15, 44.39±9.83, 35.08±8.16, 32.12±9.22 for T1 to T4, respectively.

