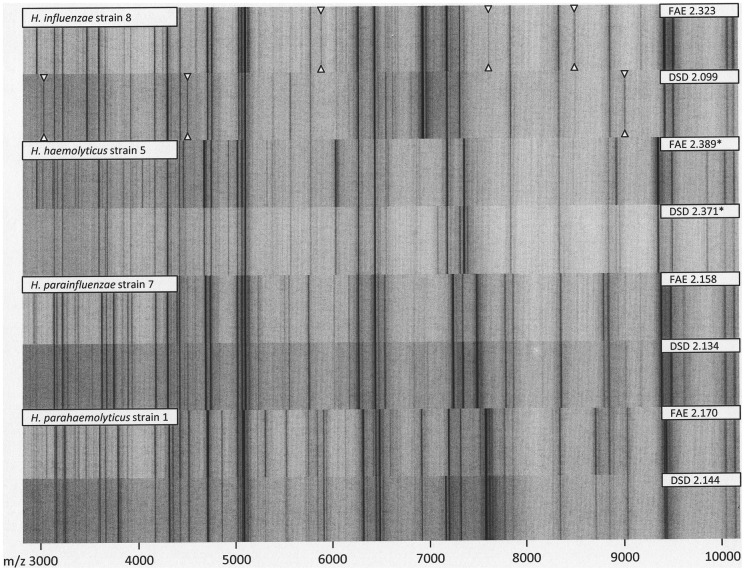
Figure 6. A comparison between formic acid extraction (FAE) and direct sample deposition (DSD) spectra for selected study isolates.
Inscribed numbers denote the Biotyper identification score. Scores for H. haemolyticus (marked with an asterisk) have been obtained from comparison with an in-house reference spectrum. Although reproducible spectral differences could be observed for some isolates (highlighted with triangles in the topmost spectrum pair), mean identification scores for both techniques did not differ significantly.

