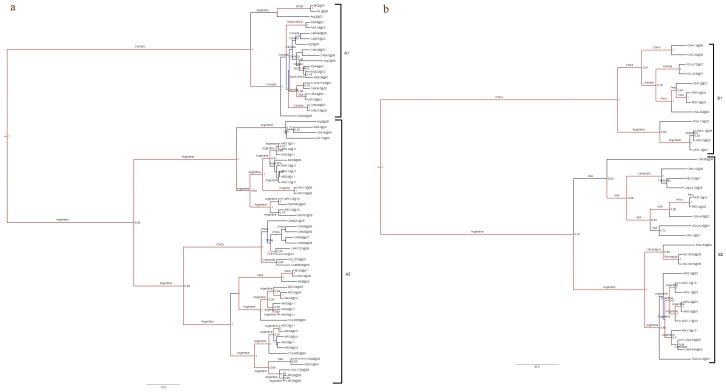
Figure 2. Maximum Clade Credibility trees.
Phylogenetic analysis and discrete phylogeographic analysis. The Tamura-Nei 93 model with a discretized gamma distributed among-site rate variation (TN93+G) with four categories was used for all the analyses. Phylogeny was inferred with representative sequences retrieved from GenBank (Tree Coded Names, GenBank accession numbers, genotypes and countries of origin are listed in Table S1). The data set was analyzed assuming a relaxed (uncorrelated lognormal) molecular clock. Bayesian Markov Chain Monte Carlo (MCMC) chains were run for 10 million ngen, 1000 samplefreq and 1000 burnin to reach convergence (expected sample size>200). Only posterior probabilities above 0.7 are shown. The discrete phylogeographic analysis was estimated from the sequences stamped with date and location. Locations of ancestor strains for individual clades are indicated in each clade. a) HMPV group A and b) HMPV group B.

