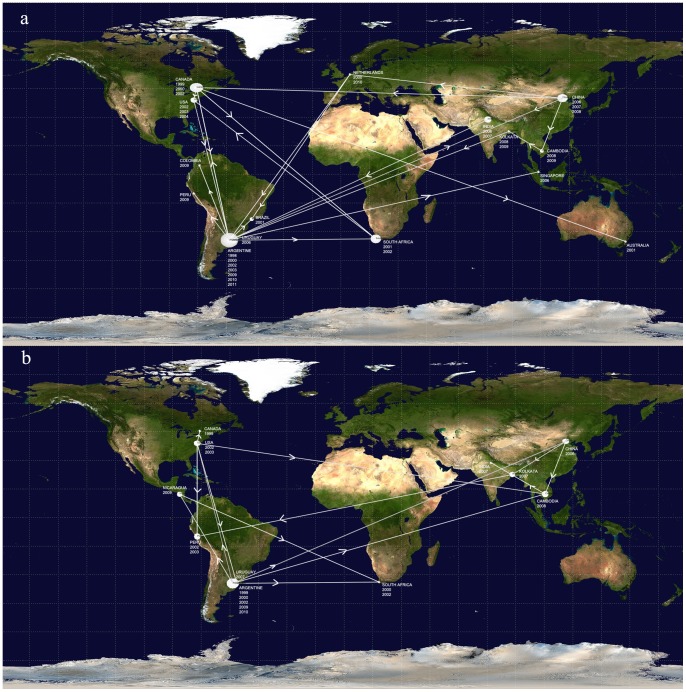
Figure 3. Discrete phylogeographic analysis.
The date and location-annotated MCC trees based on the maximum clade credibility trees of HMPV A and B were summarized in the diffusion dynamic plots with SPREAD [18]. Lines between locations represent branches in the MCC tree along which the relevant location transition occurred. a) HMPV group A and b) HMPV group B.

