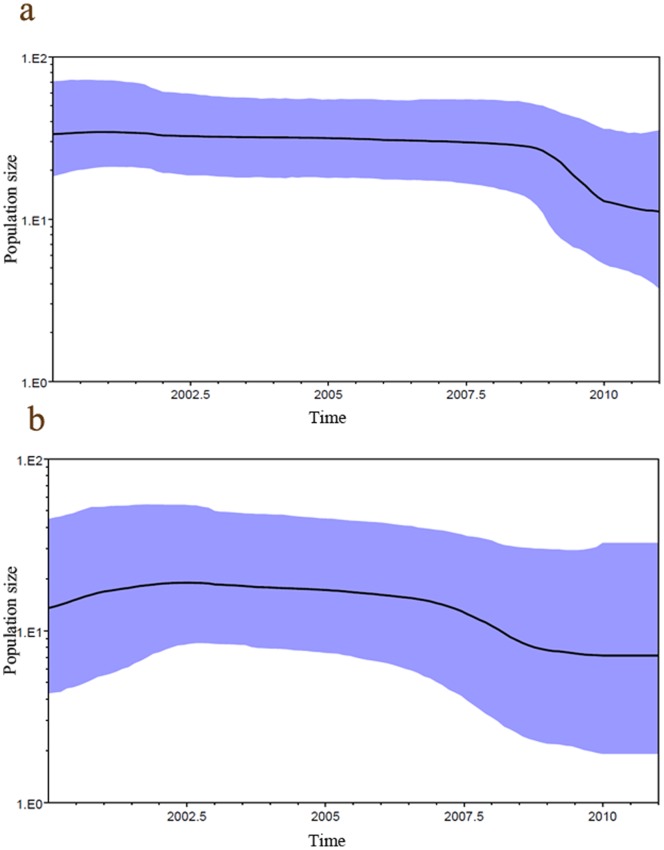
Figure 4. Population dynamics of genetic diversity in human metapneumovirus.
Bayesian skyline plots. The horizontal axes represent time in years, the vertical axes represent the population sizes (Neτ), which are equal to the product of the effective population size (Ne) and the generation length in years (τ). The violet area gives the 95% highest probability density interval of these estimates. a) HMPV group A and b) HMPV group B.

