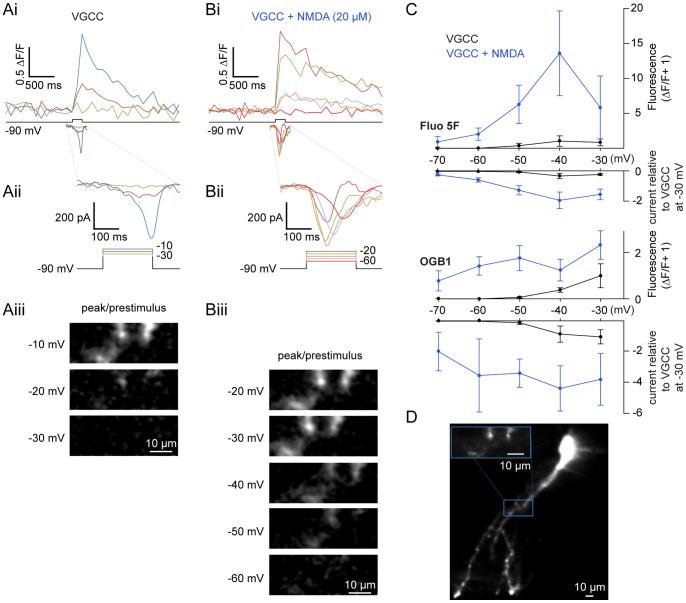
Figure 4. NMDA potentiates step-activated Ca2+ currents.
Current and fluorescence measurements made from ventral horn neurons filled with Ca2+-sensitive dyes administered via the patch pipette. A–B In whole-cell voltage clamp, a cell was filled with 200 µM Fluo 5F and 50 µM Alexa Fluor 568 hydrazide. From a holding potential of −90 mV, the cell was depolarized using varying step pulse amplitudes while simultaneously imaging a selected dendritic region using a confocal microscope. VGCC currents (Ai bottom trace, enlarged in Aii) were isolated using TTX (1 µM), TEA (5 mM), and 4-AP (1 mM) before application of NMDA (Bi bottom trace, enlarged in Bii; 20 µM). The corresponding depolarization-induced increase in Ca2+ dye fluorescence is shown (top traces, Ai–Bi) on the same time scale as bottom traces (grey box, Ai-Bi). The corresponding changes in fluorescence (displayed as peak/prestimulus fluorescence) at each step are shown below (Aiii, Biii). C Pooled step-evoked fluorescence (positive y-axis, expressed as ΔF/F+1) and current (negative y-axis, expressed as a ratio relative to the peak VGCC response at −30 mV) are compared against each voltage step (x-axis) for VGCCs before (black) and after addition of NMDA (blue, 10–100 µM) using either Fluo 5F (top, 100–200 µM) or OGB1 (bottom, 50 µM) as a Ca2+-sensitive dye. Error bars express ± SEM. D Average z-stack of the cell from A–B filled with Fluo 5F (200 µM) imaged after NMDA application. The inset (blue box) designates the region of analysis; scale bars = 10 µm.

