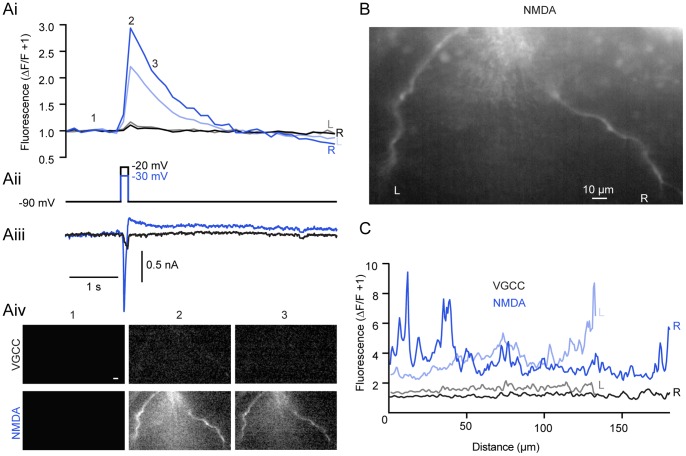
Figure 5. Discrete regions of increased Ca2+ fluorescence emerge in NMDA.
A A cell was whole-cell voltage clamped and dialyzed with Fluo 5F (200 µM) and Alexa Fluor 568 hydrazide (50 µM) and imaged using an epifluorescence CCD system. The cell was then stepped in TTX (1 µM), TEA (5 mM), and 4-AP (1 mM) from −90 mV to −20 mV (Aii, black) to activate VGCC-dependent fluorescence (Ai, black and grey) and current (Aiii, black). After NMDA (50 µM) application, step-evoked (Aii, blue) NMDA receptor-dependent Ca2+ fluorescence (Ai, dark and light blue) and current (Aiii, blue) is present at hyperpolarized potentials (Aii, −30 mV, blue). Fluorescent measurements were taken from both left (L; Ai, B, C) and right (R; Ai, B,C) dendritic branches shown in B before (black, grey) and after (blue, light blue) NMDA application. Images showing the location of fluorescent increases taken from the prestimulus (Aiv, 1), peak (Aiv, 2), and decay (Aiv, 3) of the Ca2+ signal for VGCCs (Aiv, top row, black) and after NMDA application (Aiv, bottom row, blue) from the same cell expressed as the peak/prestimulus. B Raw, unaltered image of the cell in A showing 2 prominent dendritic branches. Scale bar = 10 µm. C Profile of Ca2+ signal at response peak along left (L, grey) and right (R, black) dendritic branches (B) from VGCC step to −20 mV (Aii). After NMDA application and step to −30 mV (Aii, blue), left (light blue) and right (dark blue) show both a greater overall fluorescent signal and discrete regions of increased fluorescence along the length of dendrite. 0 µm indicates top of image for both left and right branches.

