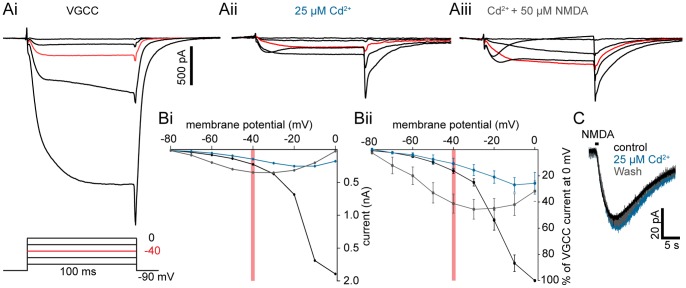
Figure 6. Effect of Cd2+ on step-evoked VGCC and NMDA receptor currents.
Step protocols performed in cells dialyzed with BAPTA (9.5 mM) demonstrating the effect of Cd2+ application to VGCC and NMDA receptor-induced currents. A A larval lamprey ventral horn neuron was whole-cell voltage clamped and stepped in TTX (1 µM), TEA (5 mM), and 4-AP (1 mM) from −90 mV to profile VGCC currents (displayed in 20 mV step increments). VGCC currents (Ai, black) are nearly abolished in Cd2+ (Aii, teal, 25 µM), but potentiated within the oscillation range (<−40 mV, red line) after NMDA (Aiii, grey, 50 µM) application. Red traces denote −40 mV, the average peak of membrane potential oscillations. B I–V plot of cell from A showing voltage-gated Ca2+ currents (Bi, black) in the presence of Cd2+ (Bi, teal) and NMDA+Cd2+ (Bi, grey). An I-V plot of cells pooled from A showing significant potentiation of evoked current in NMDA (Bii, grey) relative to Cd2+-depressed currents within the oscillation range, expressed relative to the peak VGCC current at 0 mV. Red line denotes −40 mV, the average peak of membrane potential oscillations. Error bars express ± SEM. C A neuron was whole-cell voltage clamped at −70 mV. Ringer’s solution containing NMDA (500 µM) was pressure-ejected (black bar) from a glass pipette (∼5 MΩ) in the approximate vicinity of the dendritic arbor. NMDA receptor EPSCs were recorded before (black), during (teal), and after (grey) the application of Cd2+ (25 µM).

