
Figure 2. Hair cell counts from the OC of C57 and CBA mice.
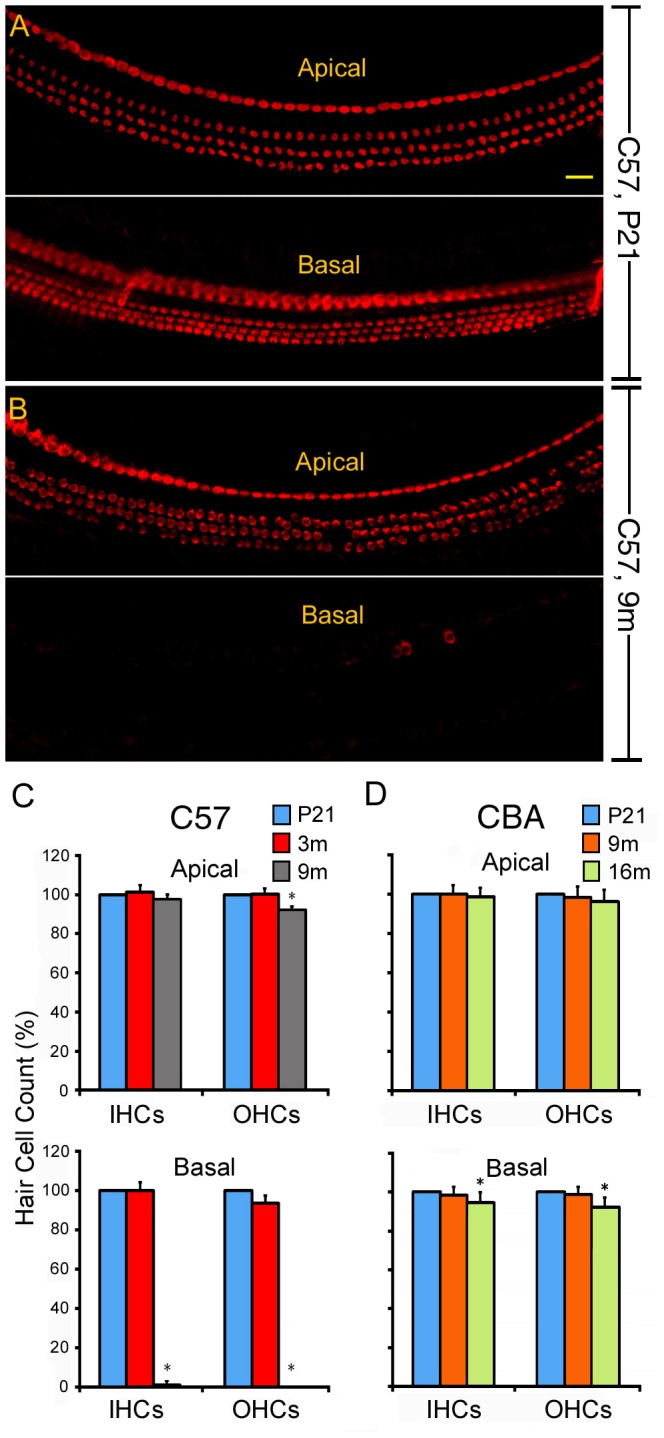
A, B: Representative confocal images of myo7a-labeled hair cells at the apical and basal turns of C57 mice at P21 (A) and 9 m (B). C, D: Hair cell counts obtained from two representative cochlear locations from C57 (C) and CBA (D) mice at different ages. The two locations were approximately 0.5–0.9 and 5.0–5.4 mm from the basal end of the basilar membrane. IHCs and OHCs were counted from each location. Three animals for each strain and age were included in the counts. The average numbers of IHCs and OHCs at each location are normalized to those of P21 mice (100%). Asterisks indicate statistically significant differences (p<0.05, Student’s t-test) compared to P21.