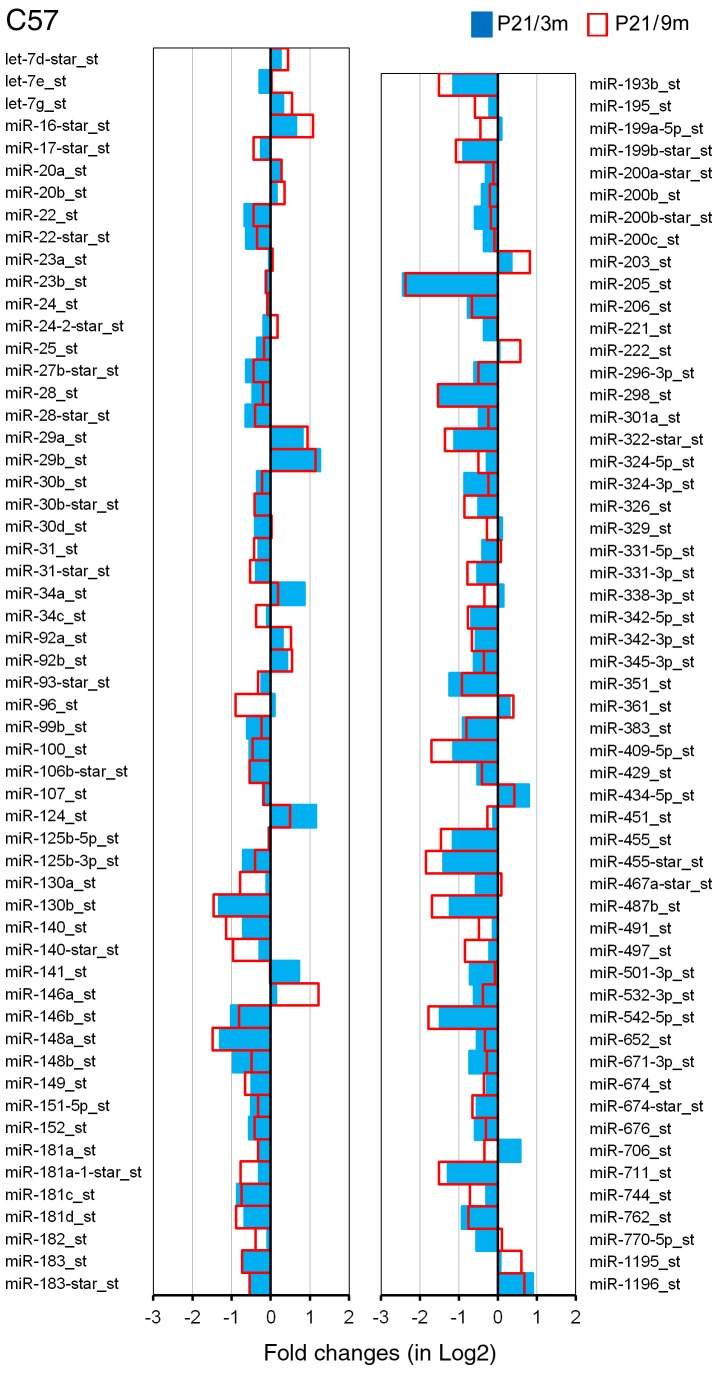
Figure 3. Differentially expressed miRNAs in the OC of C57 mice during aging.
The X-axis relates Log2 transformed fold change in miRNA expression at 3 m (in blue) and 9 m (in red) compared to P21. Only those miRNAs which showed a statistically significant different in expression (p<0.05, Student’s t-test) compared to P21 are shown.

