
Figure 5. miRNAs that are uniquely expressed in the OC of C57 mice during aging.
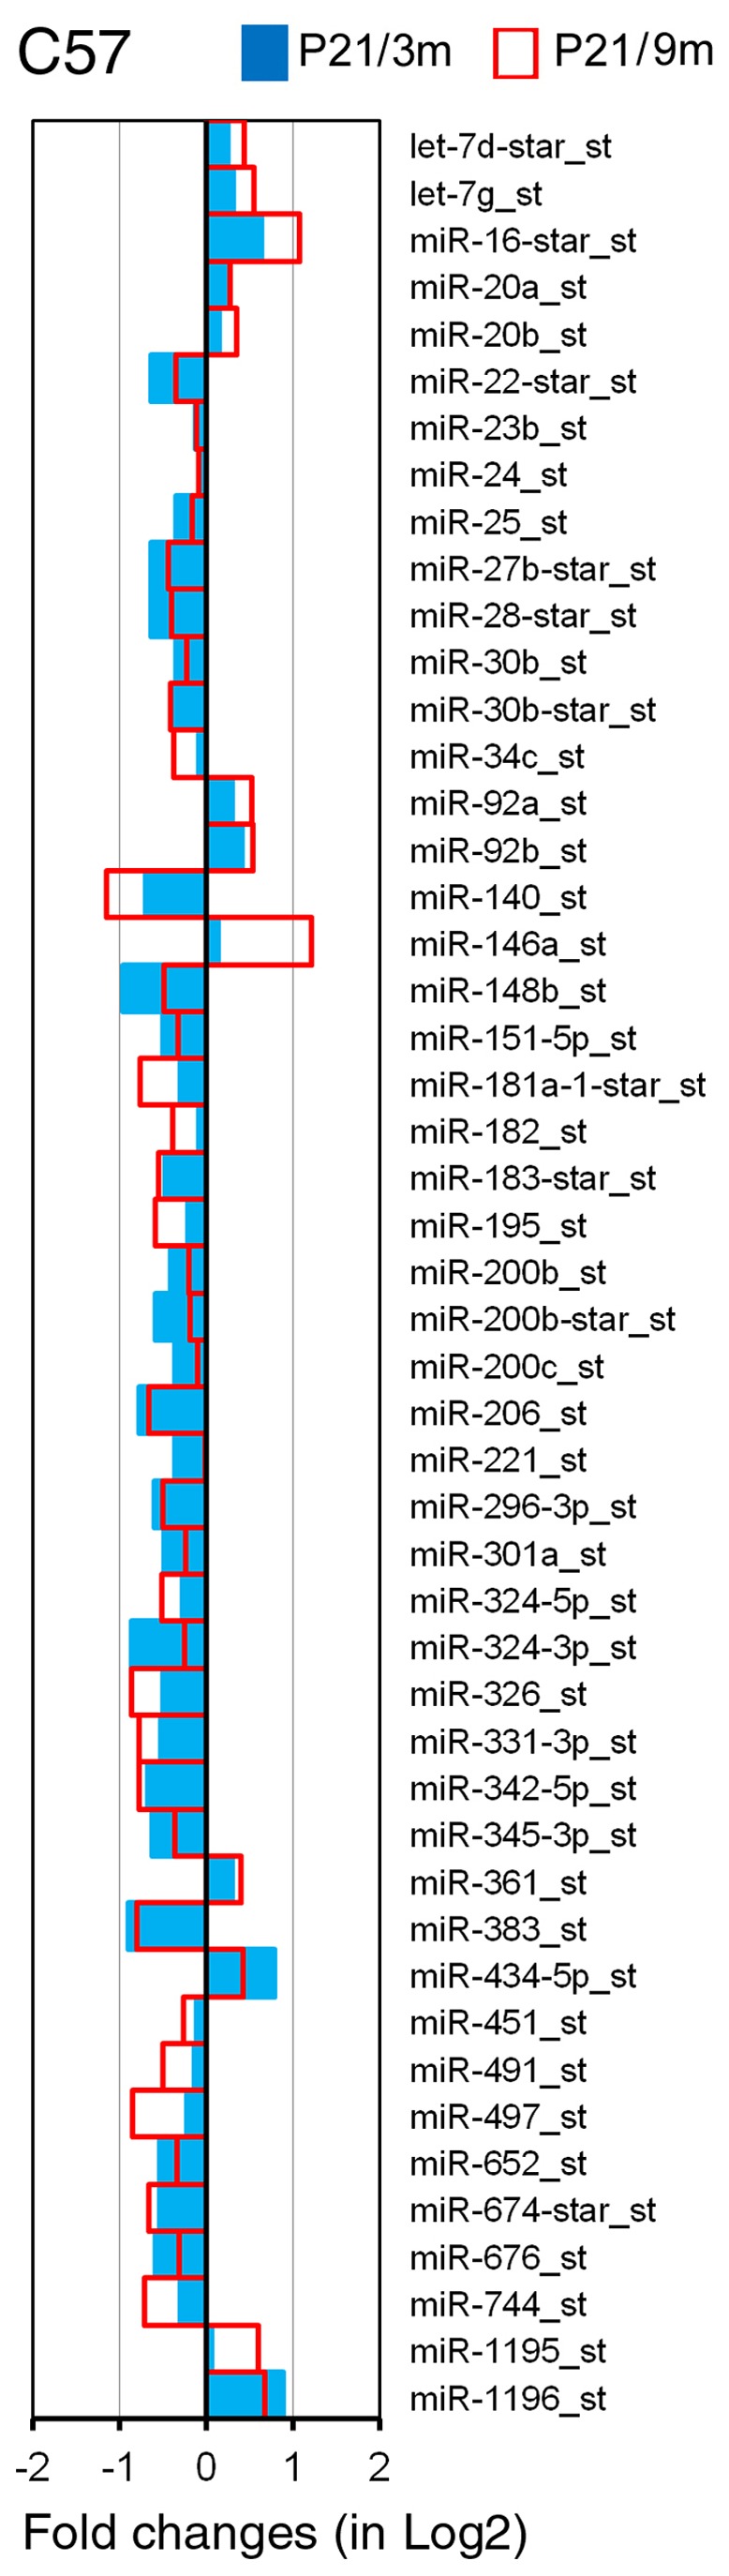
The X-axis relates Log2 transformed fold change in miRNA expression 3 m (in blue) and 9 m (in red) compared to P21.
Official websites use .gov
A
.gov website belongs to an official
government organization in the United States.
Secure .gov websites use HTTPS
A lock (
) or https:// means you've safely
connected to the .gov website. Share sensitive
information only on official, secure websites.
The X-axis relates Log2 transformed fold change in miRNA expression 3 m (in blue) and 9 m (in red) compared to P21.