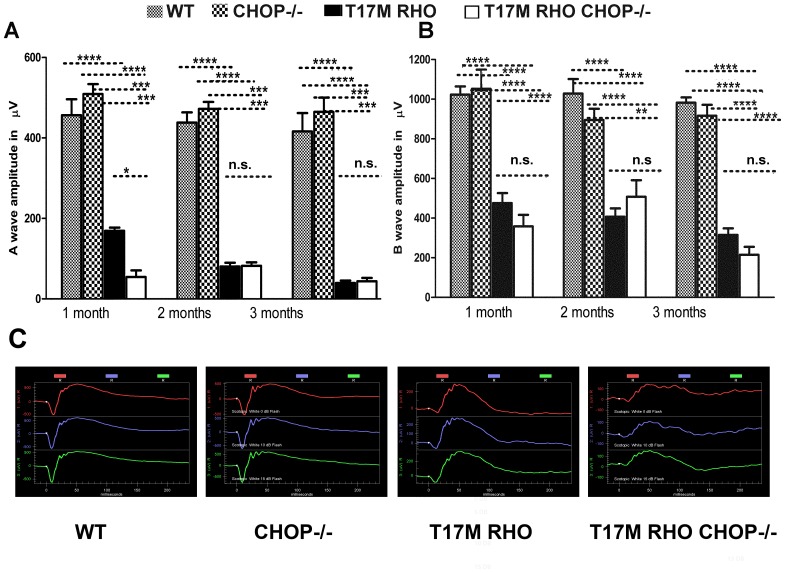
Figure 1. Lack of CHOP protein does not protect T17M RHO retinas from degeneration, as measured by scotopic ERG responses at 10DB.
We analyzed 4 groups of animals (N = 6). A: The a-wave of the scotopic ERG amplitude was diminished in T17M RHO CHOP−/− mice at 1 month of age and the values of a-wave amplitudes were 456.3 µv ±39.7 in wild-type; 509.1 µv ±24.9 in CHOP−/−; 169.0 µv ±7.9 in T17M RHO; and 54.4 µv ±16.4 in T17M RHO CHOP−/−. This data reflected a 70% difference in the a-wave amplitudes between T17M RHO and T17M RHO CHOP−/− mice. The differences between all groups were statistically significant (P<0.0001). The difference between wild-type and CHOP−/− mice was not significant (n.s.). In the 2nd and the 3rd months, the a-wave amplitudes declined in T17M RHO mice but did not decline any further in T17M RHO CHOP−/− mice (90.7 µv ±13.5 in T17M RHO vs. 82.05 µv ±8.7 in T17M RHO CHOP−/− at 2 months and 39.7 µv ±5.7 in T17M RHO vs. 44.0 µv ±8.20 in T17M RHO CHOP−/− at 3 months). In wild-type mice, the a-wave amplitude was 438.2±25.4, vs. 472 µv ±17.3 in CHOP−/− mice at 2 months, while it was 416.2 µv ±45.5 in wild-type vs. 464.9 µv ±35.2 in CHOP−/− mice at 3 months. At 2 and 3 months, the differences between wild-type or CHOP−/− and T17M RHO or T17M RHO CHOP−/− groups were significant (P<0.001), but we did not register any differences between wild-type and CHOP−/− mice at 1, 2, or 3 months of age and difference between T17M RHO and T17M RHO CHOP−/− mice at 2 and 3 months of age. B: The b-wave of the scotopic ERG amplitude was decreased in T17M RHO CHOP−/− mice over the 3 examined months when compared to T17M RHO retinas. In 1-month-old animals, the b-wave amplitudes were 1023.0 µv ±41.6 in wild-type; 1052.0 µv ±96.5 in CHOP−/−; 475.6 µv ±50.7 in T17M RHO; and 358.2 µv ±58.2 in T17M RHO CHOP−/−. The differences between all groups were statistically significant (P<0.0001), except between T17M RHO and T17M RHO CHOP−/−, which was not significant. In the 2nd and 3rd months, the b-wave amplitudes in the T17M RHO mice declined. However, in the T17M RHO CHOP−/− mice, they were consistently low during the next 2 months. The b-wave amplitudes were 407.1 µv ±41.7 in T17M RHO vs. 428.7.5 µv ±67.0 in T17M RHO CHOP−/− at 2 months and 315.3 µv ±32.7 in T17M RHO vs. 214.9 µv ±40.0 in T17M RHO CHOP−/− at 3 months and were not significantly different. No difference was detected between the wild-type and CHOP−/− mice (1028.0 µv ±73.4 in wild-type vs. 894.7 µv ±56.9 in CHOP−/− at 2 months and 982.4 µv ±26.4 in wild-type vs. 916.2 µv ±55.5 in CHOP−/− at 3 months). However, at 2 months, the differences between the wild-type and T17M RHO or T17M RHO CHOP−/− mice were significant at the P<0.0001 level as were those between the CHOP−/− and T17M RHO mice, while the differences between the CHOP−/− and T17M RHO CHOP−/− mice were significant at the P<0.01 level. At 3 months, the differences between the wild-type and T17M RHO or T17M RHO CHOP−/− mice were significant at the P<0.00001 level, while those between CHOP−/− and T17M RHO or T17M RHO CHOP−/− were significant at the P<0.0001 level. The difference in the b-wave of the ERG amplitude between T17M RHO and T17M RHO CHOP−/− mice was not significant at 3 months. C: Images of the scotopic ERG amplitudes registered at 0 DB or 2.5 cd*s/m2 (in red), 10 DB or 25 cd*s/m2 (in blue) and 15 DB or 79.1 cd/m2 (in green) in four groups of animals.

