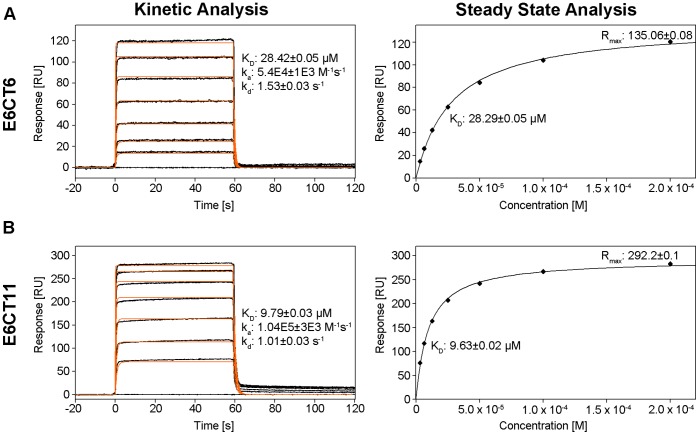
Figure 5. 51Z2 derived E6CT6 peptide versus E6CT11 peptide binding to hDlgPDZ2.
SPR data. A E6CT6, B E6CT11. Sensorgrams of E6CT6 and E6CT11 binding injected in triplicate (black lines) are shown overlaid with the best fit derived from a 1∶1 interaction model including a mass transport term (orange lines). Peptide concentrations of 3.125, 6.25, 12.5, 25, 50, 100 and 200 µM are shown. The binding parameters were obtained by kinetic analysis of association and dissociation phases (left panels) or by steady state analysis (right panels) utilizing signals of plateaus depicted in the corresponding left panel.

