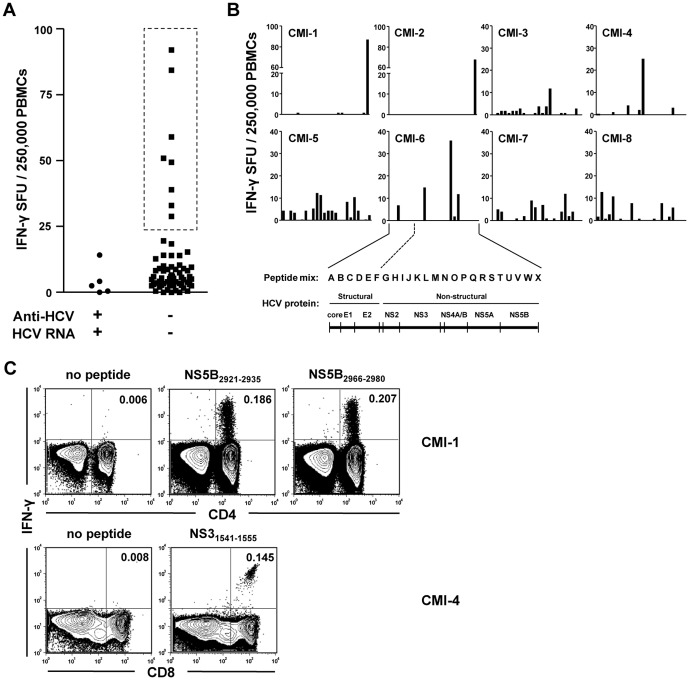
Figure 1. HCV-specific T cell responses in seronegative, aviremic hemodialysis patients.
(A) Direct ex vivo IFN-γ ELISpot assay was performed to examine HCV-specific T cell responses in PBMCs of 76 hemodialysis patients. Five patients were seropositive with viremia (left side), and 71 patients were seronegative and aviremic (right side). PBMCs were stimulated with the 49 matrix mixes of 600 overlapping peptides covering the complete HCV polyprotein sequence (Materials and Methods and Figure S1A). The sum of A-X mixes and the sum of AA-YY mixes were calculated respectively, and their average value was presented for total HCV-specific T cell responses in each patient. Box with dashed lines denotes seronegative, aviremic patients with obvious T cell responses. (B) In the eight seronegative, aviremic patients with obvious T cell responses (CMI-1 to CMI-8), the results of IFN-γ ELISpot assay were presented by each peptide mix (A to X). Relationship between peptide mixes and HCV proteins are also displayed. (C) IFN-γ ICS was performed to identify the T cell subset responding to HCV epitopes. PBMCs were stimulated with epitope peptides identified in the IFN-γ ELISpot assay in the each patient. FACS dot plots are representative data from two patients, CMI-1 and CMI-4.

