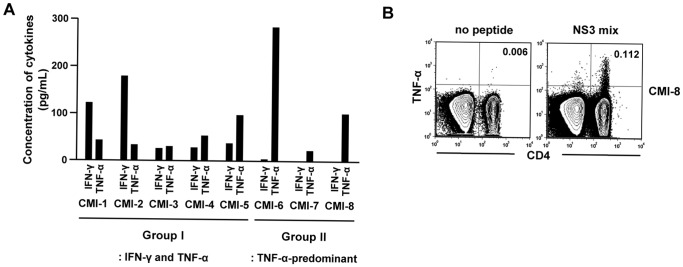
Figure 2. Cytokine profile of HCV-specific T cells in seronegative, aviremic hemodialysis patients.
(A) After stimulating PBMCs with an epitope peptide or a peptide mix for 3 days, culture supernatant was harvested, and the concentrations of IFN-γ and TNF-α determined in the culture supernatant by CBA. There are two groups of patients in terms of cytokine profile: group I, patients with IFN-γ and TNF-α responses; group II, patients with TNF-α-predominant responses. (B) TNF-α ICS was performed in the patients of group II. FACS dot plots are representative data from two patients, CMI-7 and CMI-8.

